Engineering Failure Modes — When Steady State Meets Cache Misses and Cascading Failure
1. The Comfortable Model of Caching
Caching is one of the most reliable performance techniques in production systems.
By serving repeated reads from memory instead of a backend datastore, caches reduce latency, lower infrastructure cost, and smooth out normal variations in traffic. In many systems, they are the difference between an API that struggles under load and one that operates comfortably within its limits.
When this works—and it often does—the signals are familiar. Cache hit rates are high. Backend query volume is low. Latency distributions tighten. Over time, these signals become shorthand for system health. A cache that hits frequently and keeps the database quiet is considered successful.
This mental model is not naive. It reflects how caches behave in steady state, under normal operating conditions, when the assumptions they rely on continue to hold. For long stretches of time, nothing contradicts it.
A Mental Model Built on Observation
The comfort around caching comes from experience.
Teams deploy caches, see latency drop, watch backend load flatten, and gain confidence. Over weeks or months of stable operation, the cache becomes invisible. It fades into the background as part of the system’s “normal”.
This lived experience matters. It is why caching is trusted—not because of theory, but because it works most of the time.
That trust is well-earned.
Hence, this mental model on Caching is definitely grounded in truth, but it is incomplete.
What the Mental Model Explains — and What It Doesn’t
The standard model explains why caches make systems faster.
It explains how repeated reads avoid expensive backend work.
It explains why average latency improves and why databases stay quiet.
What it does not emphasize is that caches also act as traffic regulators.
Every cache implicitly splits traffic into two paths: work that is absorbed and work that is passed through. The ratio between those two is determined by the hit–miss profile of the cache. In steady state, that ratio is stable, and the system learns to rely on it.
What the usual cache mental model does not prepare us for is how sensitive that split is to change.
When conditions shift—even briefly—the proportion of traffic that reaches the backend can change dramatically, without any change in overall incoming request rate. The cache does not merely become less effective; it alters how workload is distributed through the system.
That gap rarely shows up in benchmarks or load tests. It tends to surface later, during incidents that are difficult to attribute to any single failure.
Caches are commonly treated as performance optimizations.
But they inevitably act as traffic shapers, even when not considered as such.
What This Article Is Really About
This article is not about introducing a new caching technique or proposing a better configuration.
It is about examining what is implicitly assumed when caches work well, and what happens when those assumptions are violated in ways that are operationally ordinary but structurally significant.
To do that, we’ll follow the behavior of a very simple system—one that most engineers would consider safe—as it encounters a very ordinary change.
No exotic failure modes.
No heroic scale.
Just a system behaving exactly as it was designed to behave.
2. A Simple System, Deliberately So
To examine how cache behavior changes under ordinary conditions, we start with a system that is intentionally uncomplicated.
At its core is a read-heavy endpoint:
GET /users/{id}/profile
It returns basic user profile data—attributes, preferences, and metadata used across clients (web, mobile, integrations, etc.). Writes exist, but they are infrequent relative to reads, and most data changes rarely.
This is the kind of endpoint teams almost always cache.
Request Path
The request path is straightforward.
A client calls the API.
The API checks an in-process cache.
On a cache hit, the response is returned immediately.
On a cache miss, the API fetches data from the database and stores it back in the cache.
There is no batching, prefetching, or coordination logic at the cache layer. Misses pass through directly.
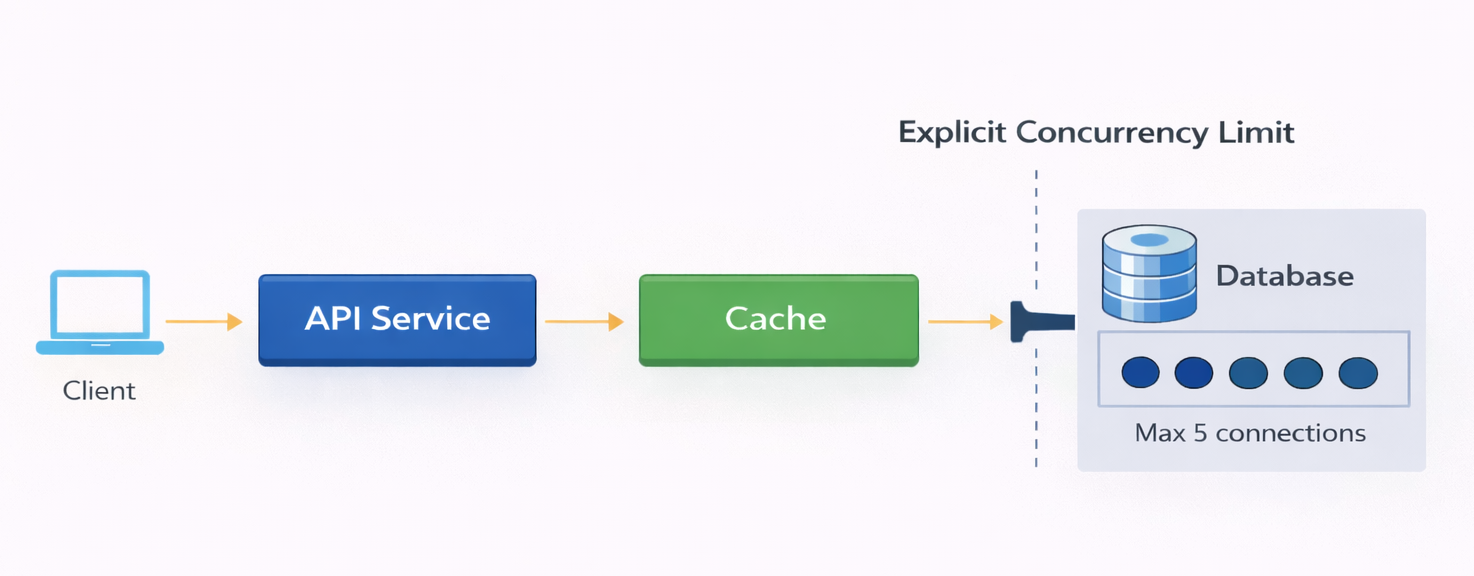
A simple request path of in a cached system.
About the Simulation (Optional)
This demo is fully reproducible, but understanding the article does not require reading the code.
For readers who want to run the system or inspect behavior directly, the full setup is available on GitHub:
https://github.com/kramankishore/cache-containment
The simulation is intentionally minimal and runs locally using Docker Compose. It is designed to surface system behavior clearly, without unnecessary complexity.
At a high level:
- The API is implemented using FastAPI
- The cache is simulated in application code
- The database behavior—including latency and connection pooling—is modeled explicitly rather than using a real database
- Prometheus is used to collect metrics
- Grafana is used to visualize system behavior
The repository can be cloned and run locally to reproduce both steady-state and transient behaviors shown throughout this article.
Traffic and Load
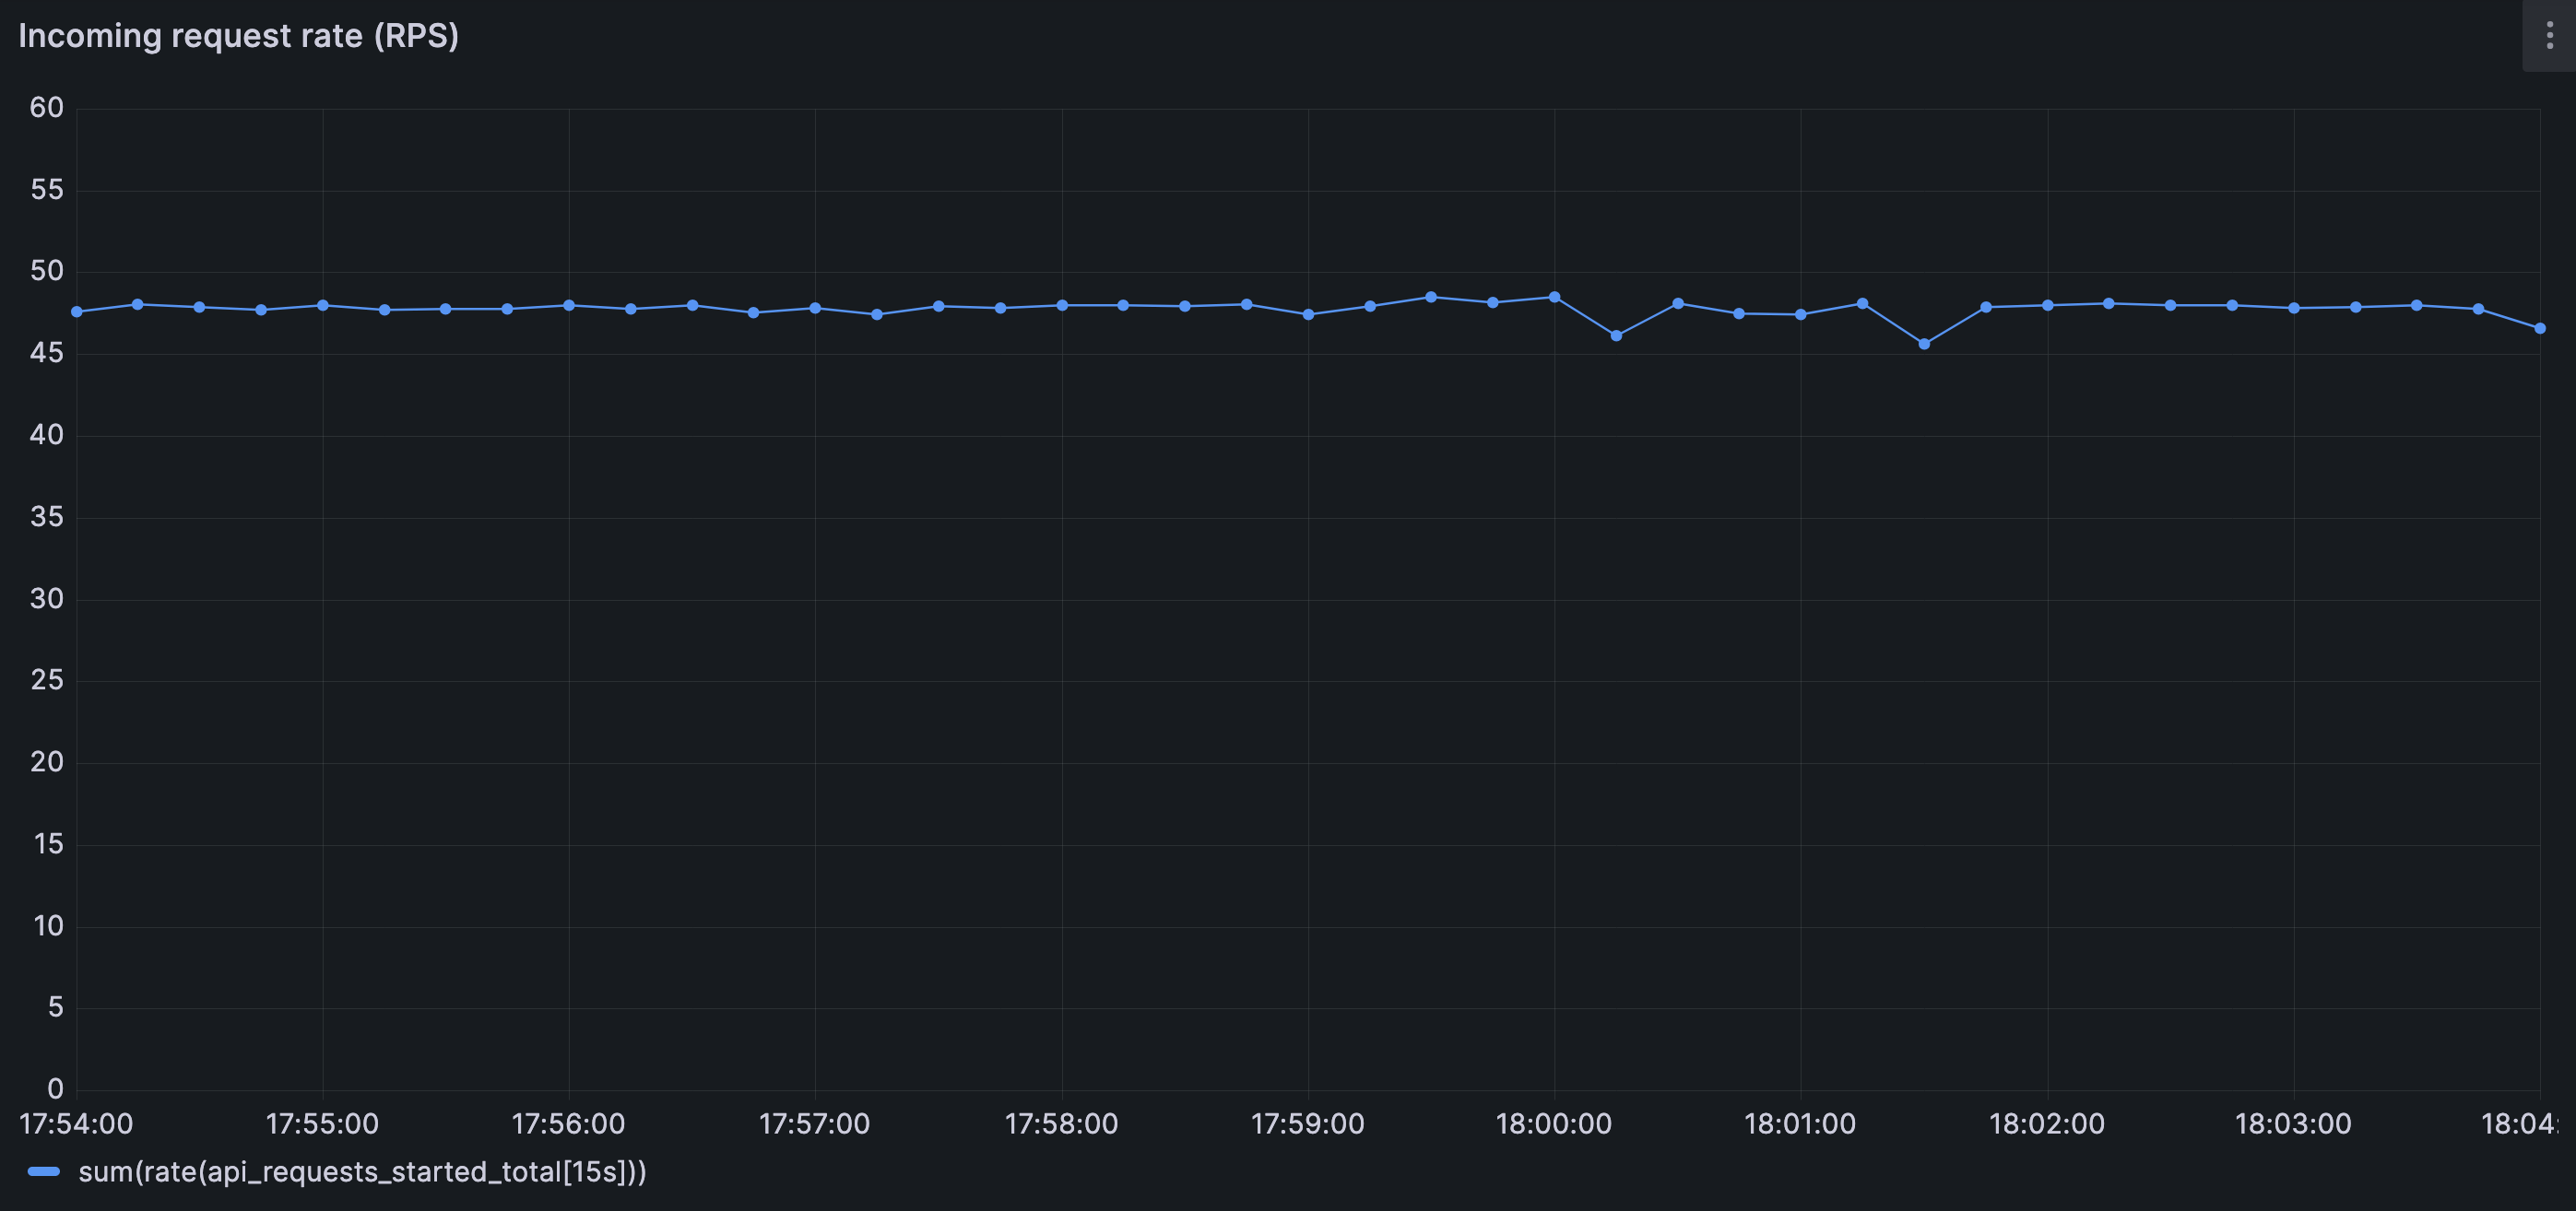
The system is driven by a steady load of 50 requests per second.
Requests arrive continuously and are evenly distributed across a large user ID space. There are no hot keys, no bursts, and no adversarial patterns. The request rate does not change during the run.
The specific number (50 RPS) is not important. What matters is the shape of the traffic: stable, predictable, and sustained.
This choice is deliberate. The goal is not to stress the system, but to observe how it behaves when nothing appears unusual.
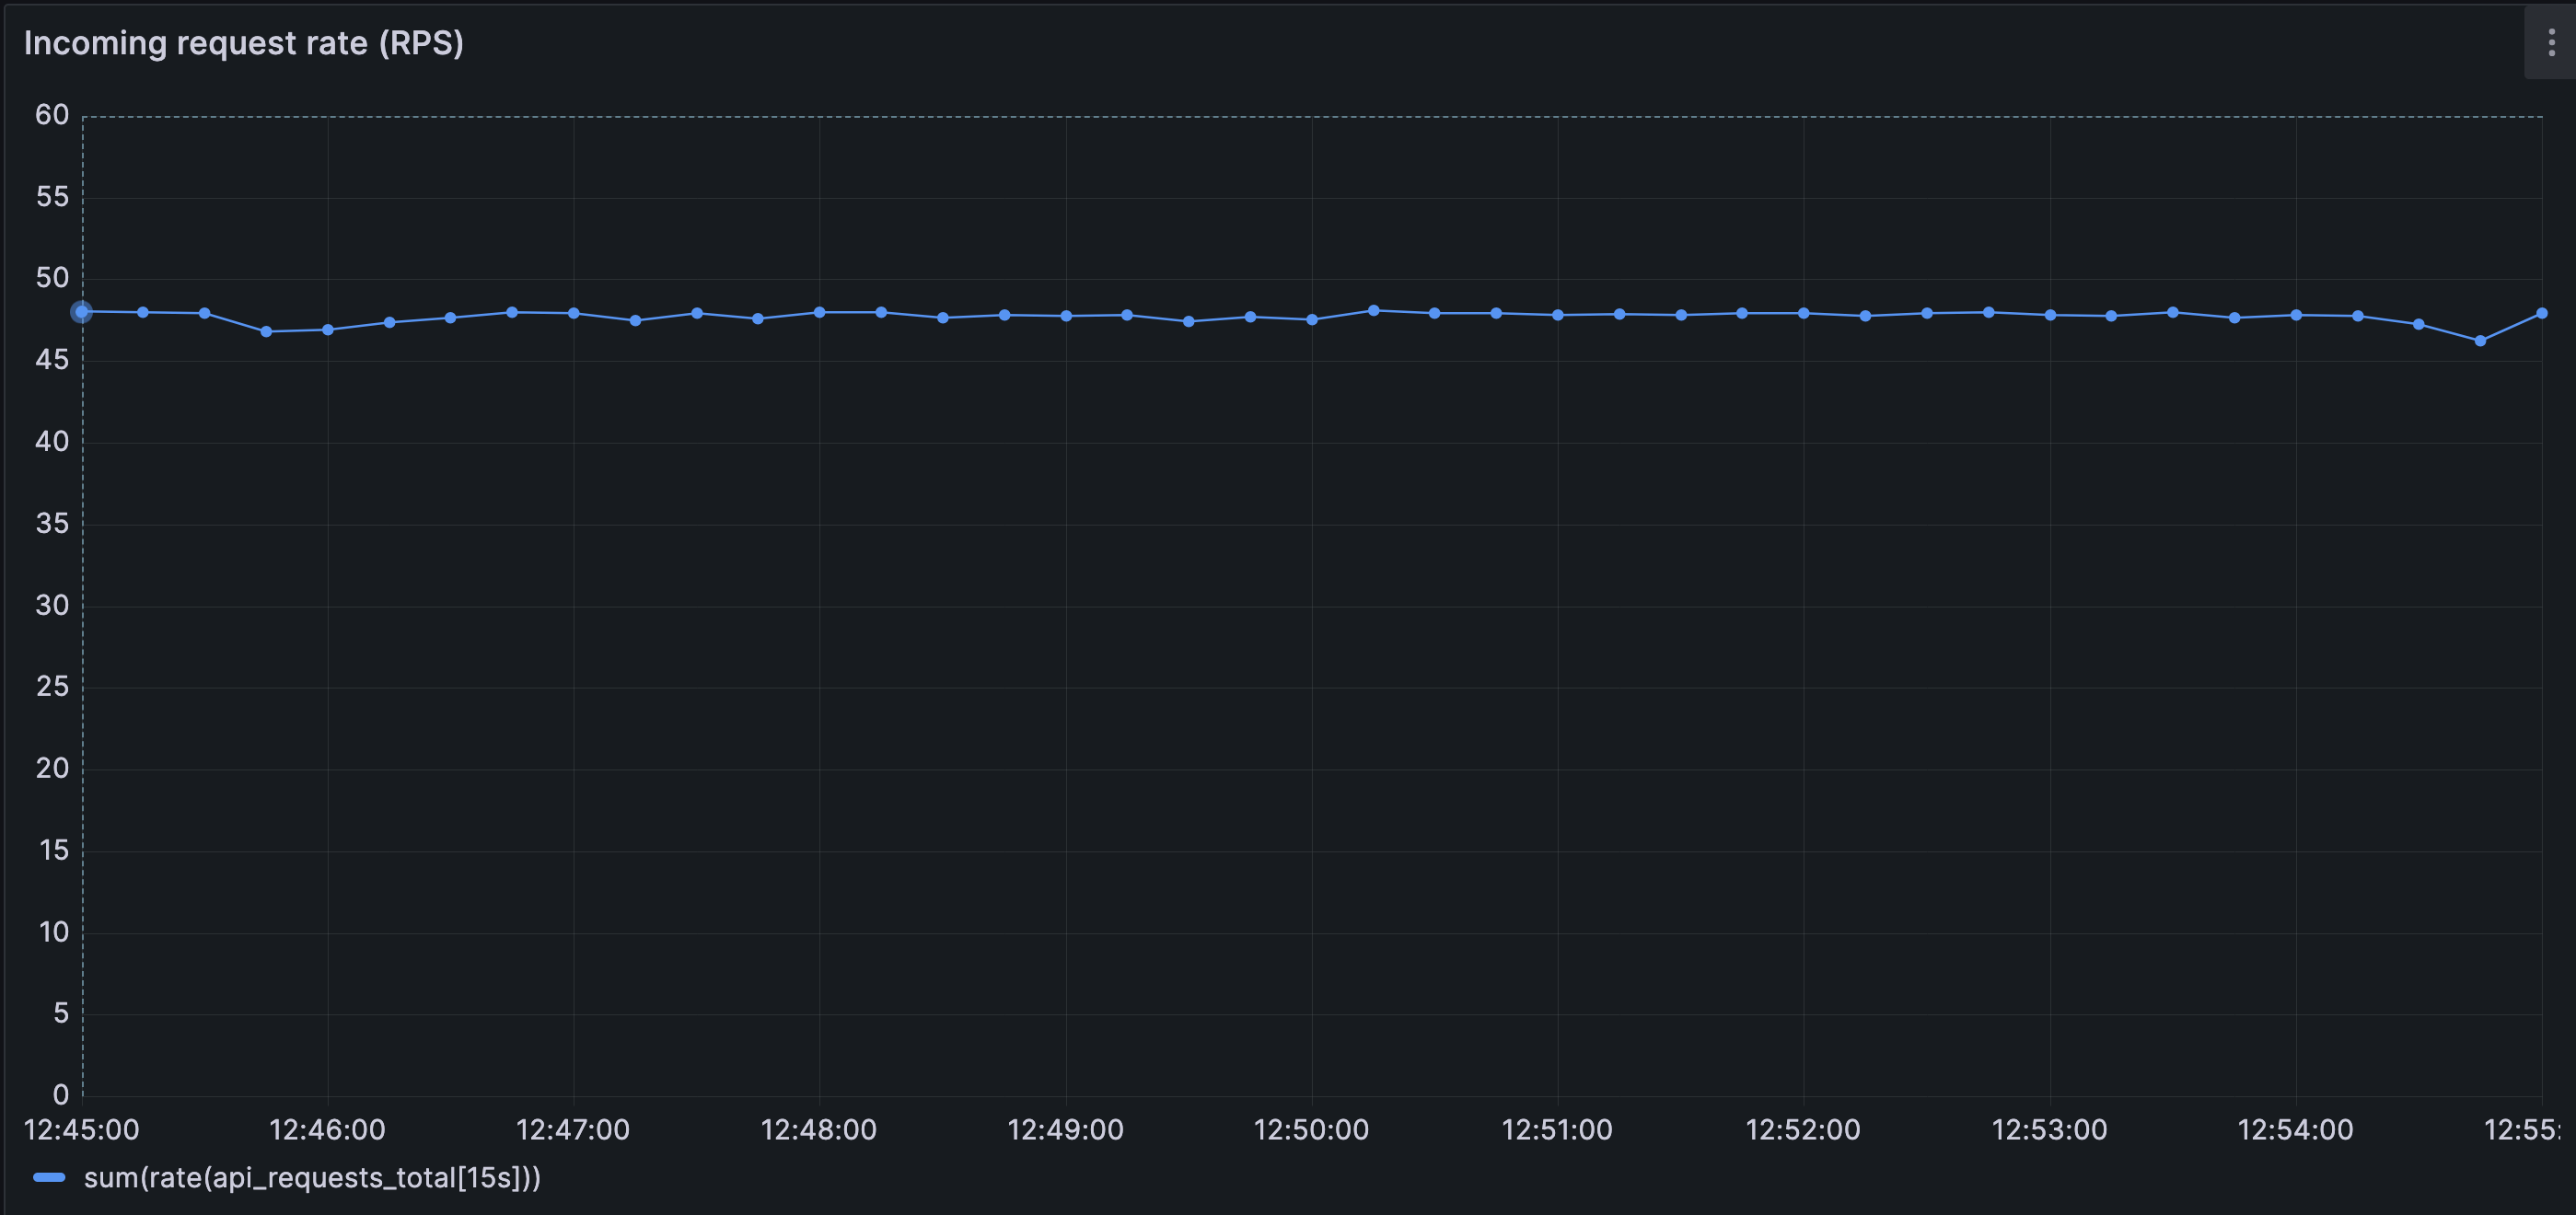
Incoming request rate remains steady (around 50 RPS) and bounded over time; there is no incoming traffic spike.
Backend Configuration
The database is protected by a fixed-size connection pool.
For this demo:
- The pool allows five concurrent connections
- Each query takes approximately 400 milliseconds
- Requests that cannot acquire a database connection within one second time out
These values are chosen to make concurrency limits visible, not to create fragility. Under normal conditions, the backend operates comfortably within these bounds.
These numbers themselves (50 RPS, 5 concurrent connections) are not important; the structural constraints they illustrate are.
Baseline Observations
With a warm cache and steady traffic:
- Most requests are served from memory
- Database connection usage remains low
- Waiting is rare
- No timeouts occur
- Latency is stable and predictable
The behavior described in this section comes from a small, reproducible simulation; the full setup is available on GitHub for readers who want to inspect or run it themselves (not mandatory to understand the article):
https://github.com/kramankishore/cache-containment
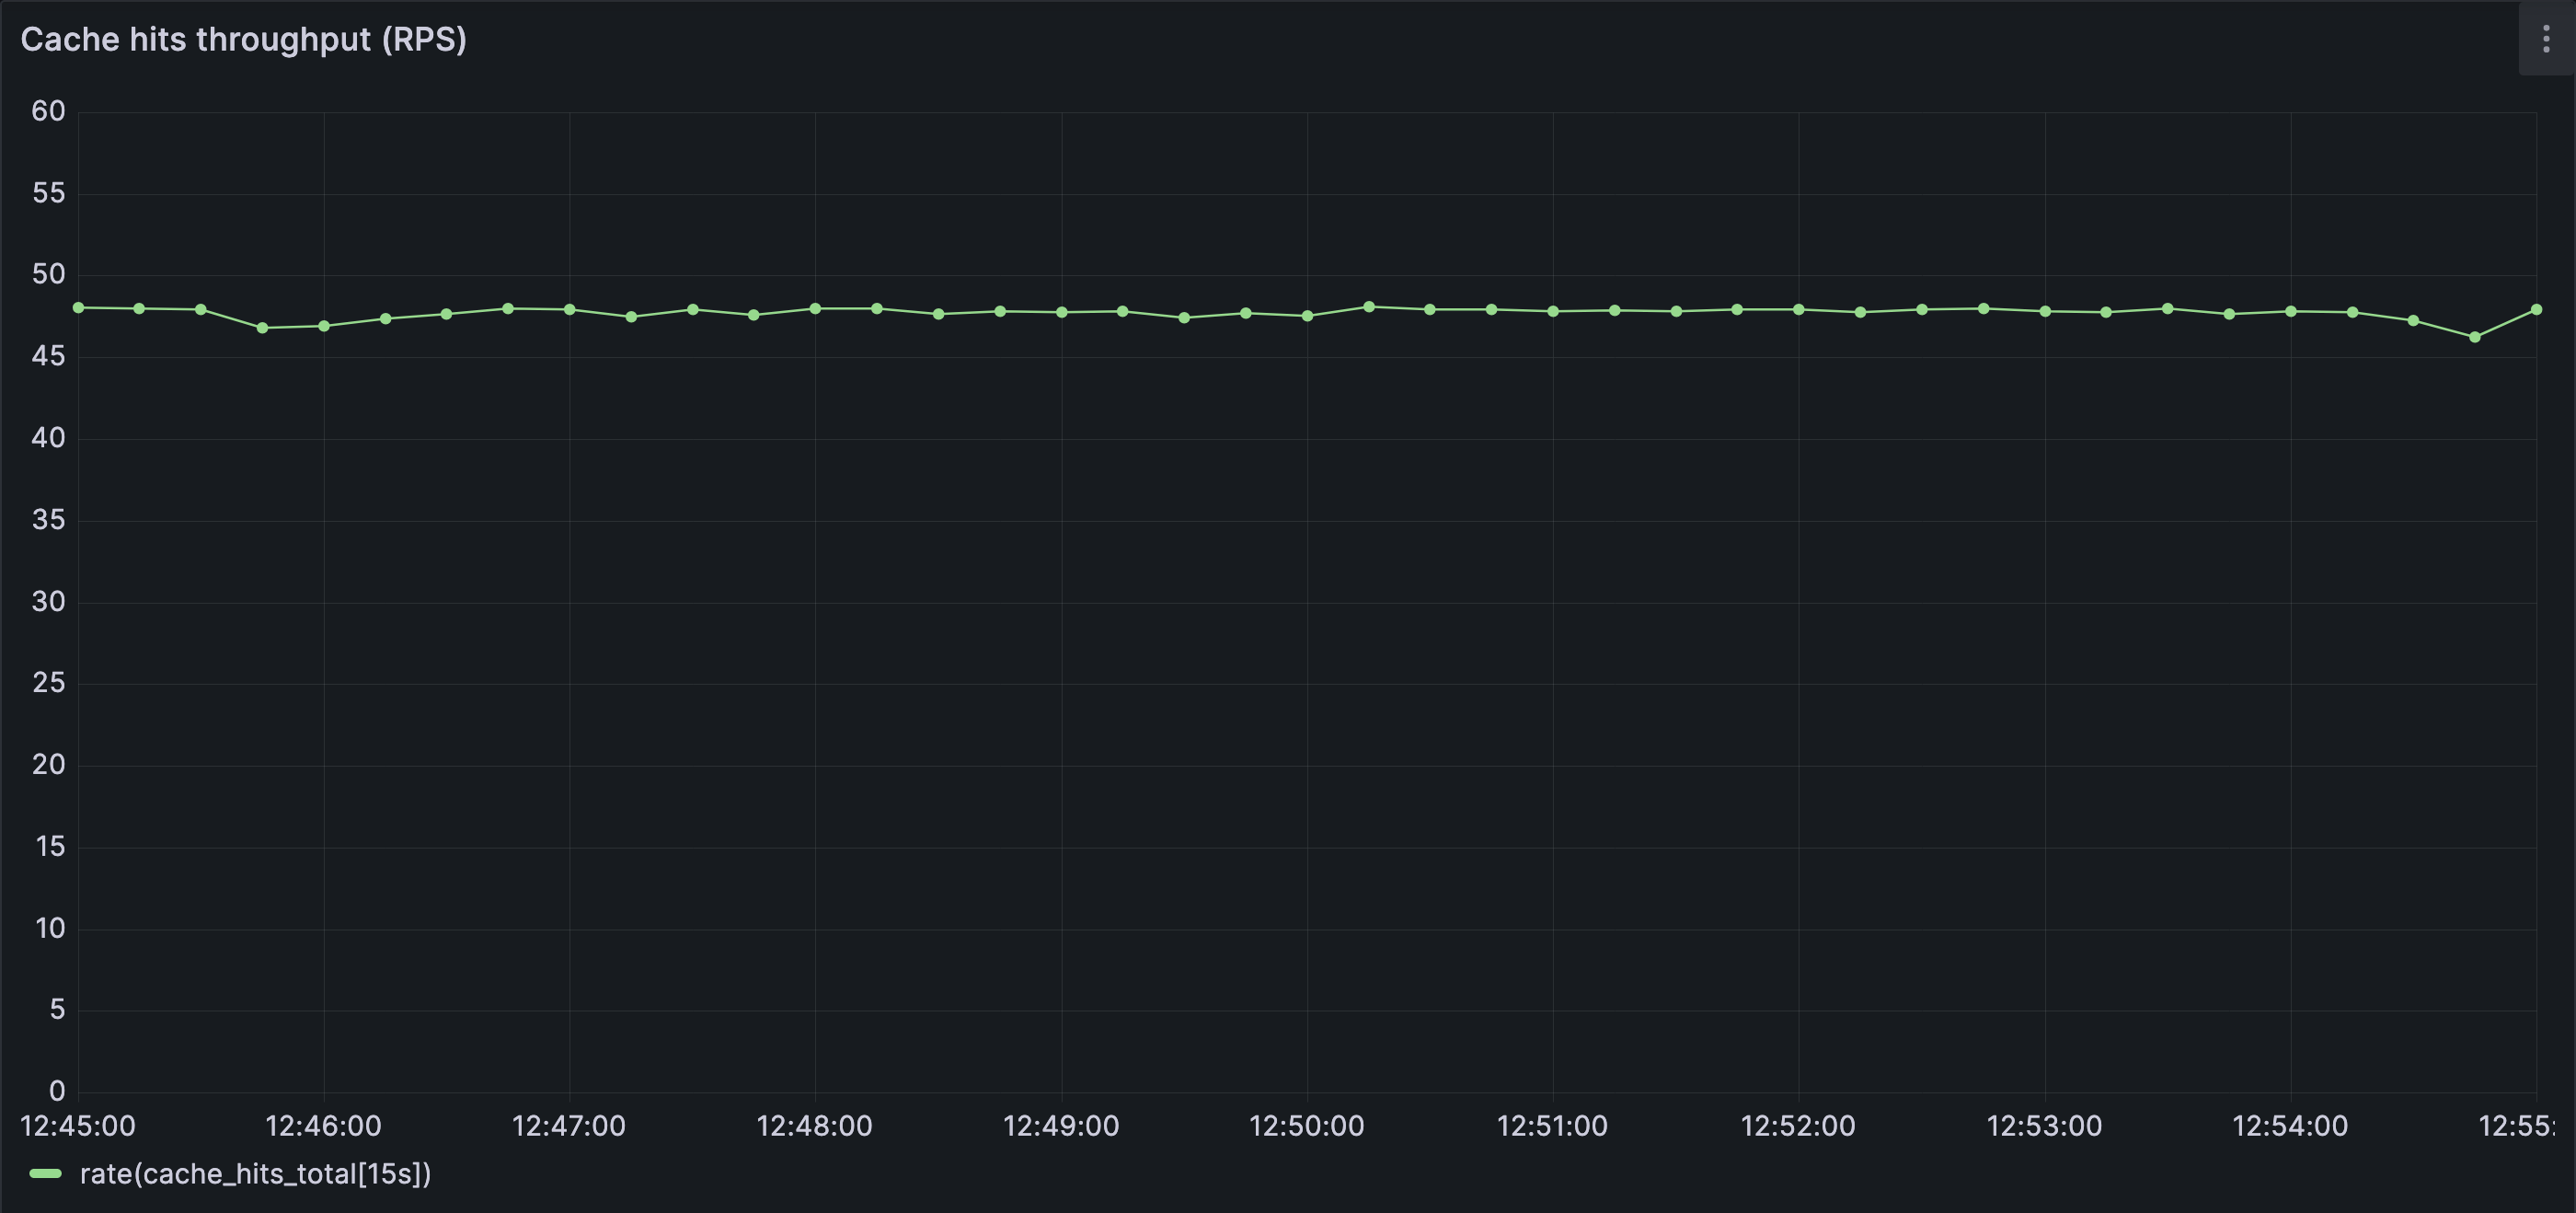
Most requests are served directly from cache in steady state, closely matching the incoming request rate of 50 RPS and keeping database load low.
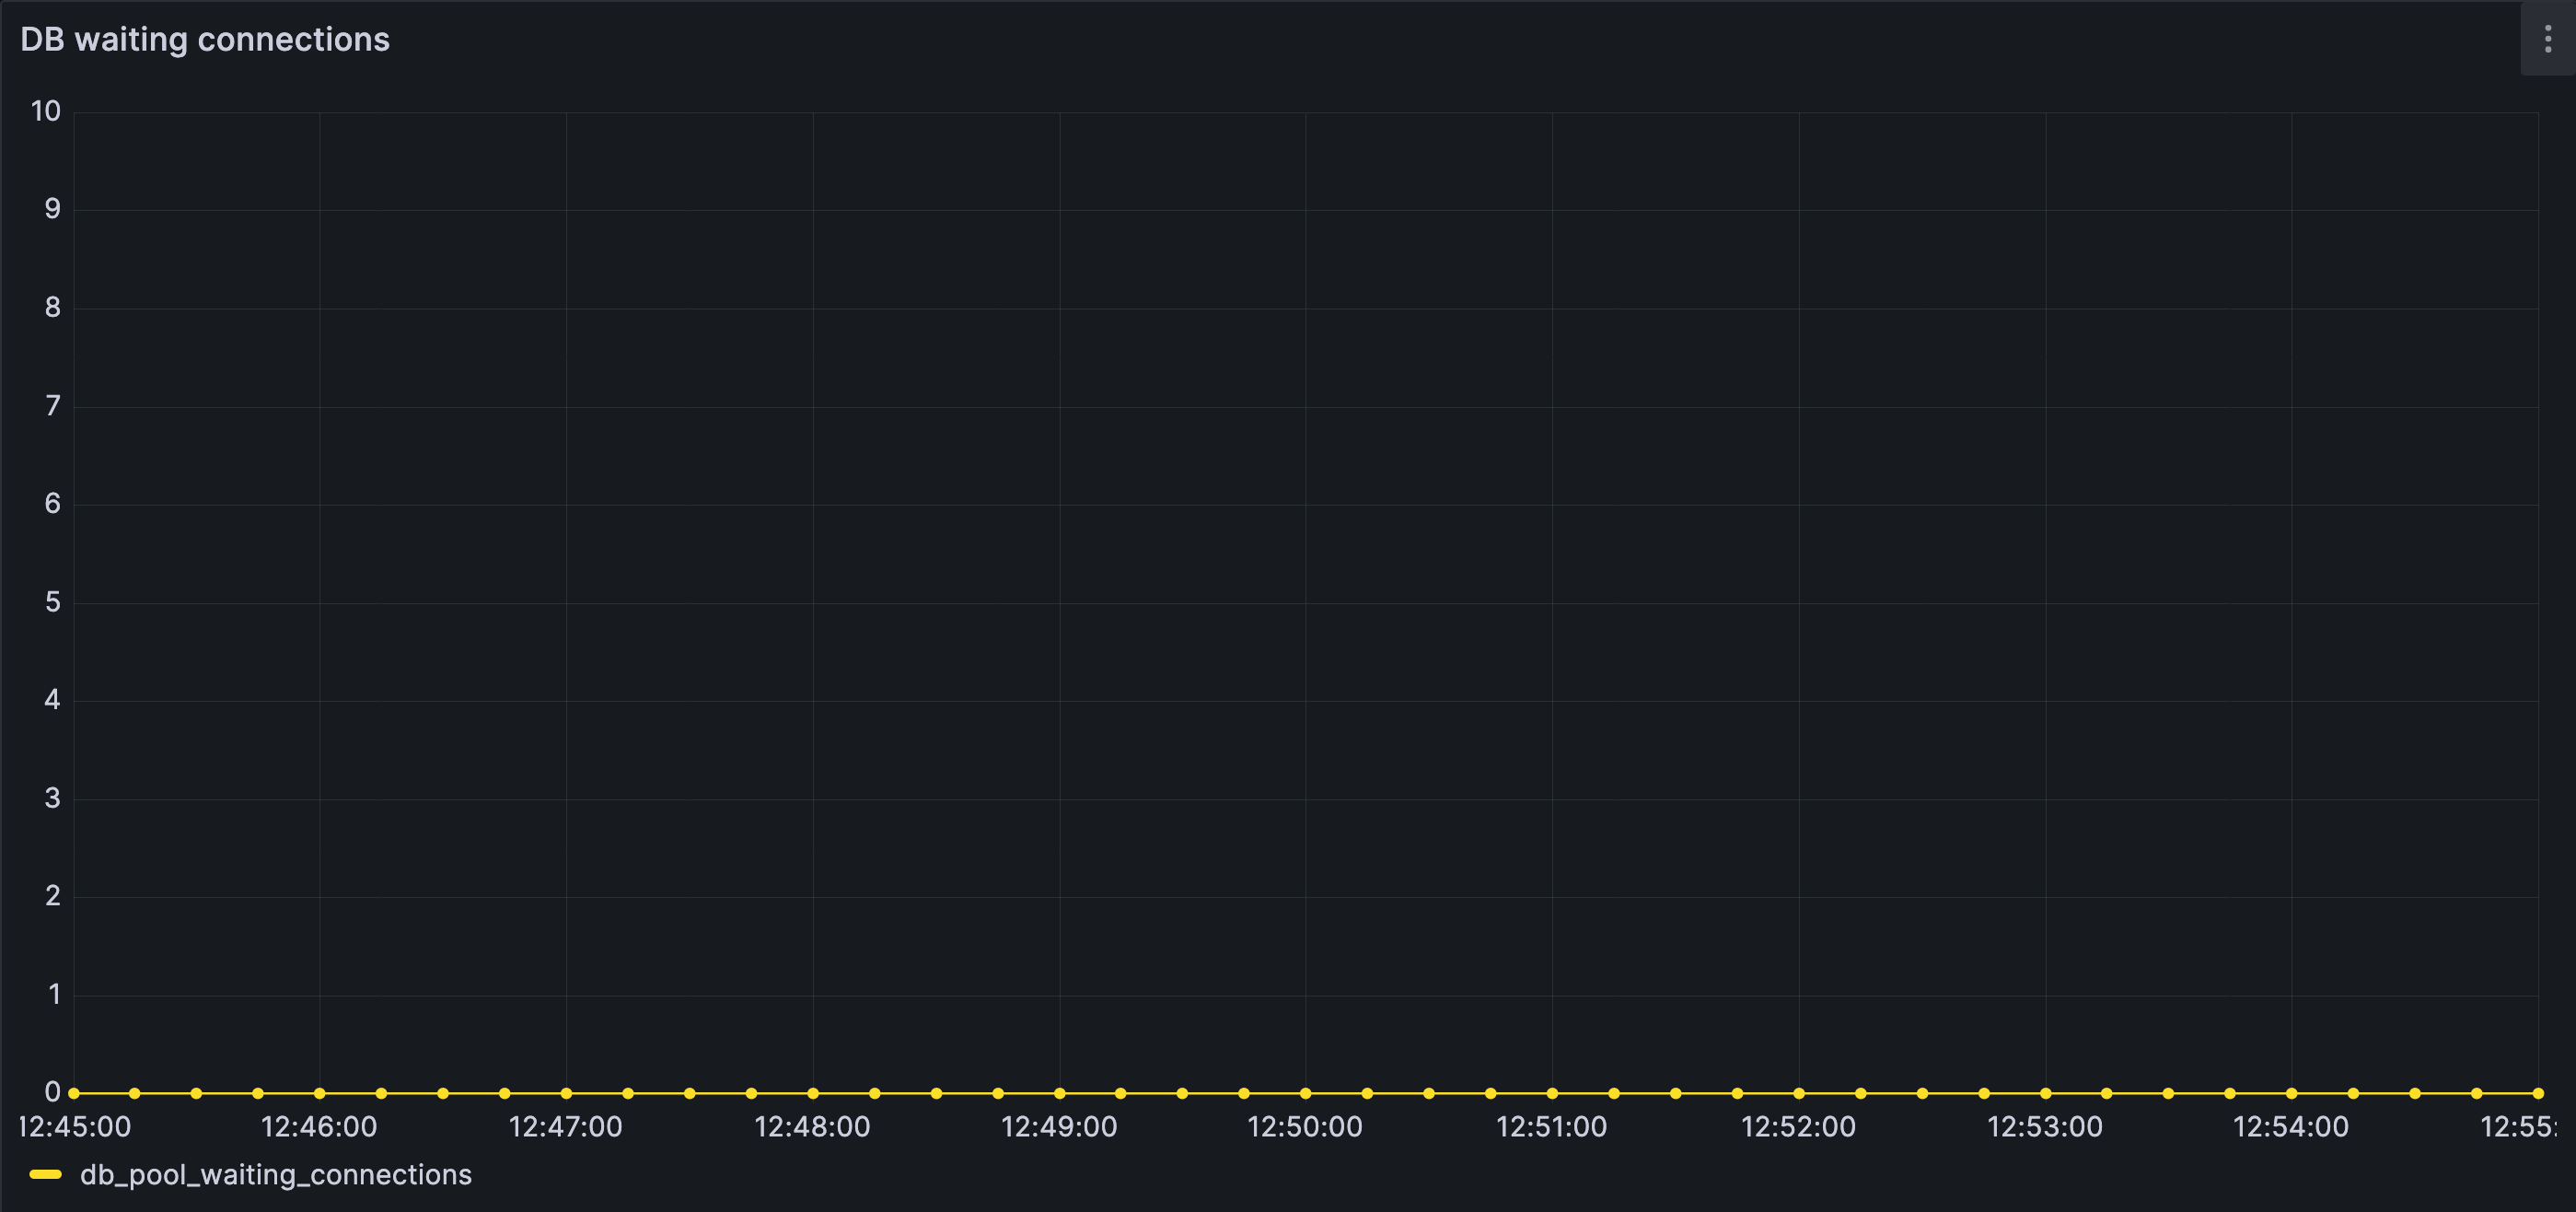
No requests are waiting for database connections; concurrency remains comfortably within configured limits.
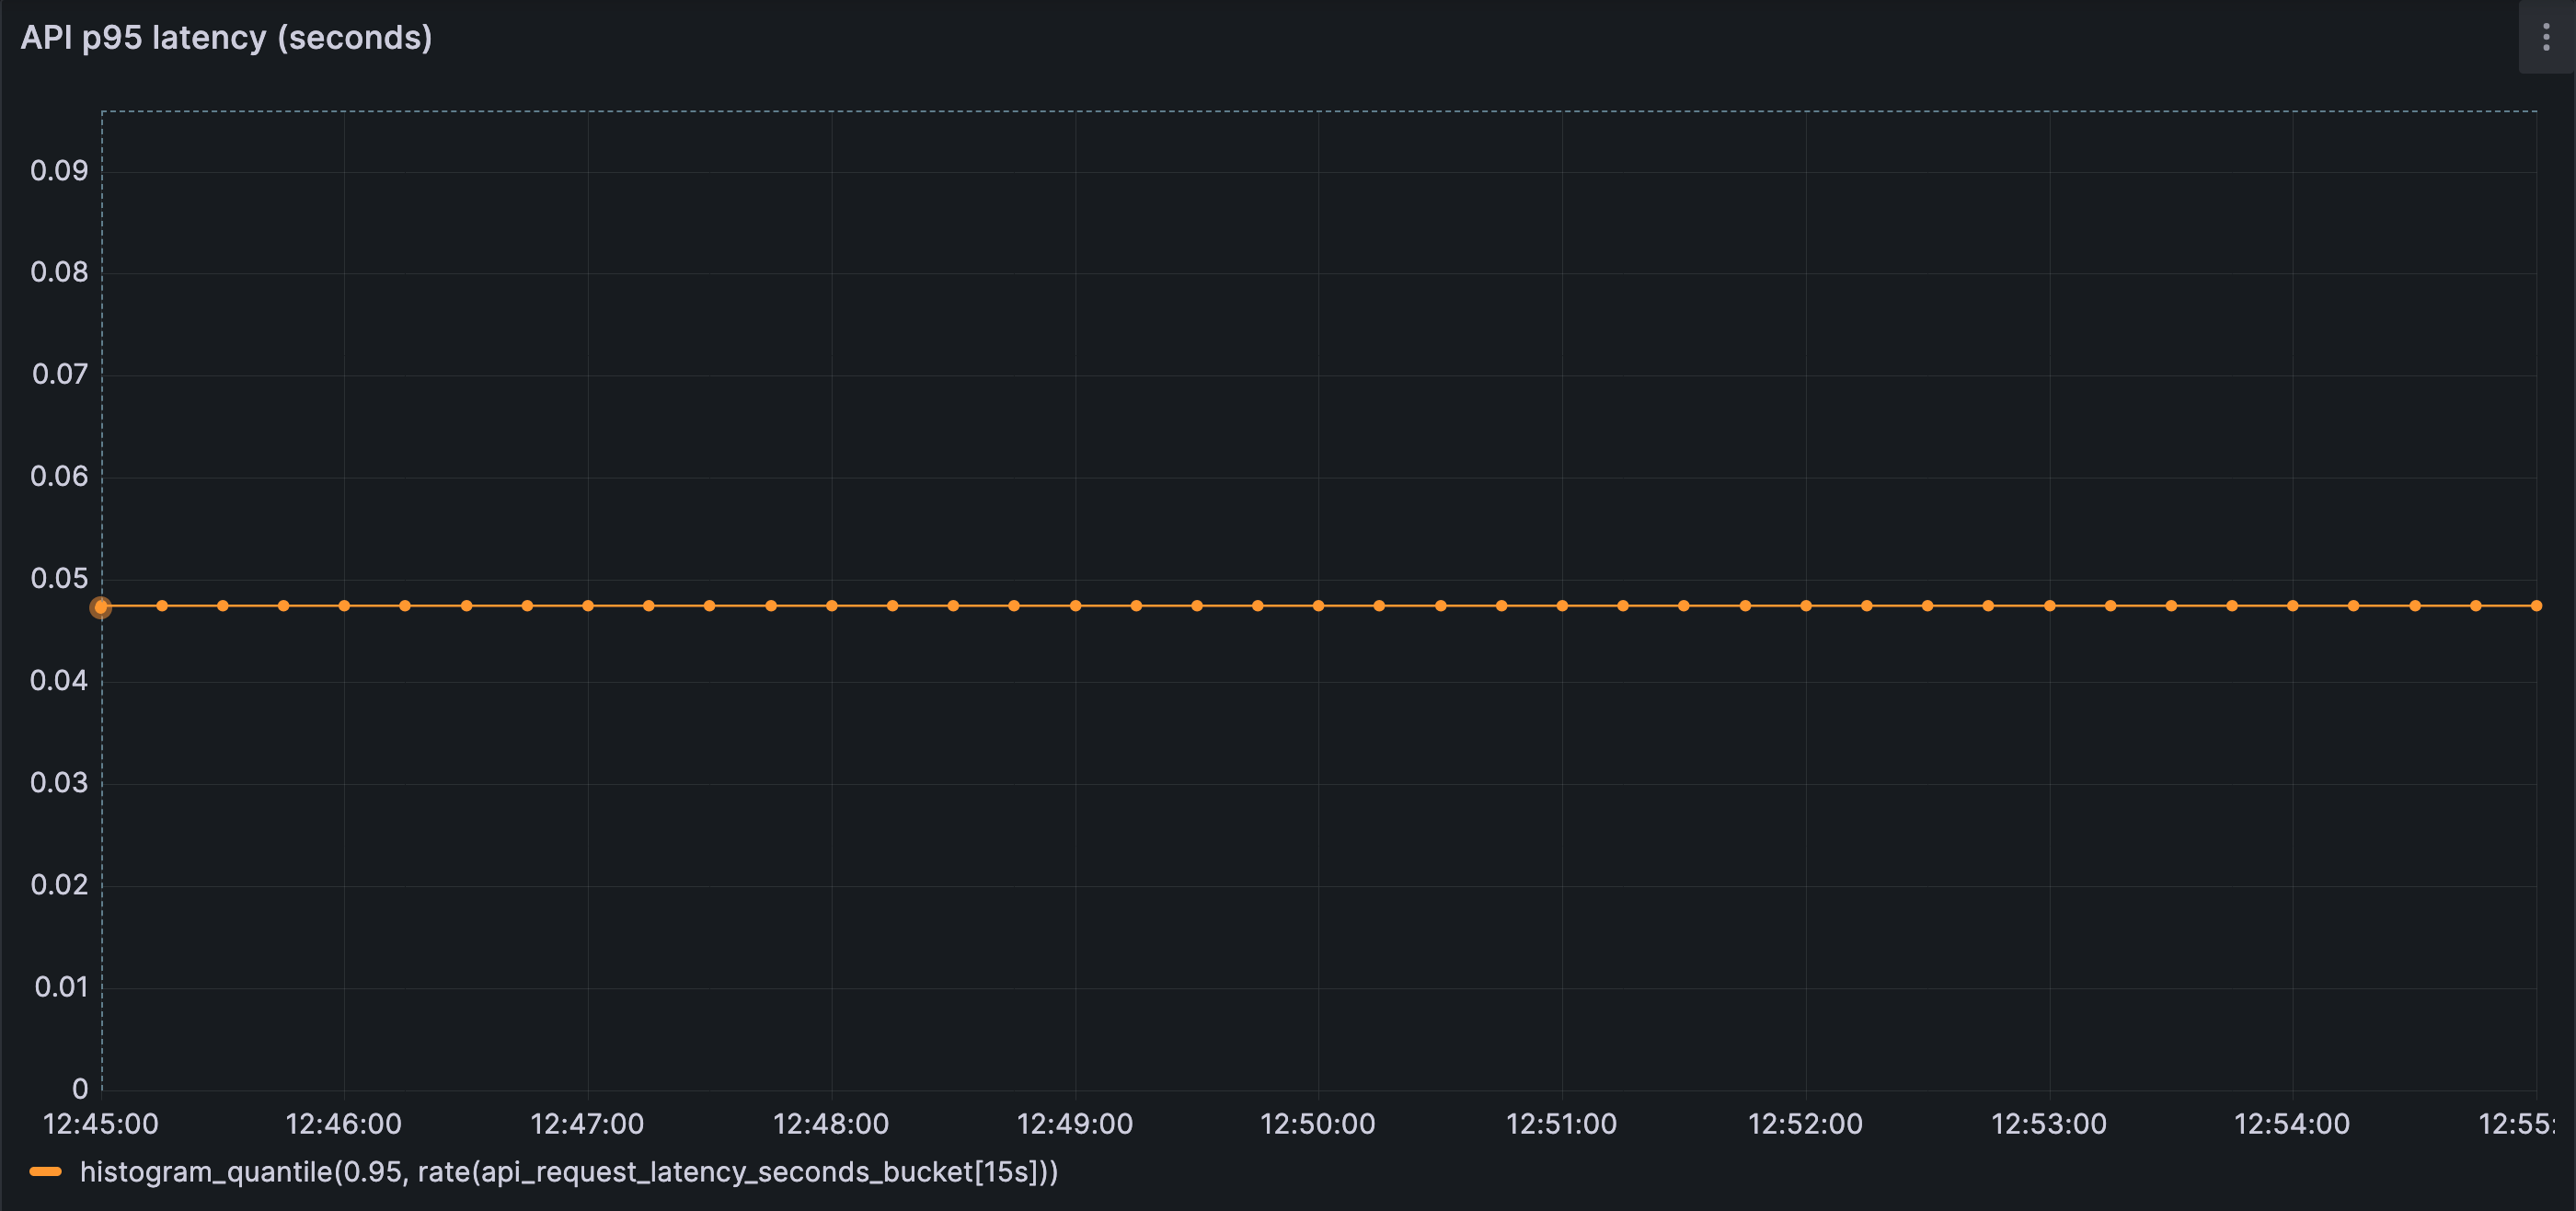
End-to-end latency is stable and well within expected bounds, reflecting a healthy steady state.
Nothing in these observations suggests instability.
This section establishes only one thing: the system behaves calmly under steady conditions.
3. Where Control Lives
Up to this point, the system has been described only in terms of what exists and what is observed.
This section is about what that structure implies.
Not all limits in a system play the same role. Some shape behavior intentionally. Others emerge only once things start going wrong. The difference between the two explains much of what we observed—and much of what is about to happen.
Explicit Concurrency Limits Versus Implicit Limits
Every system has limits.
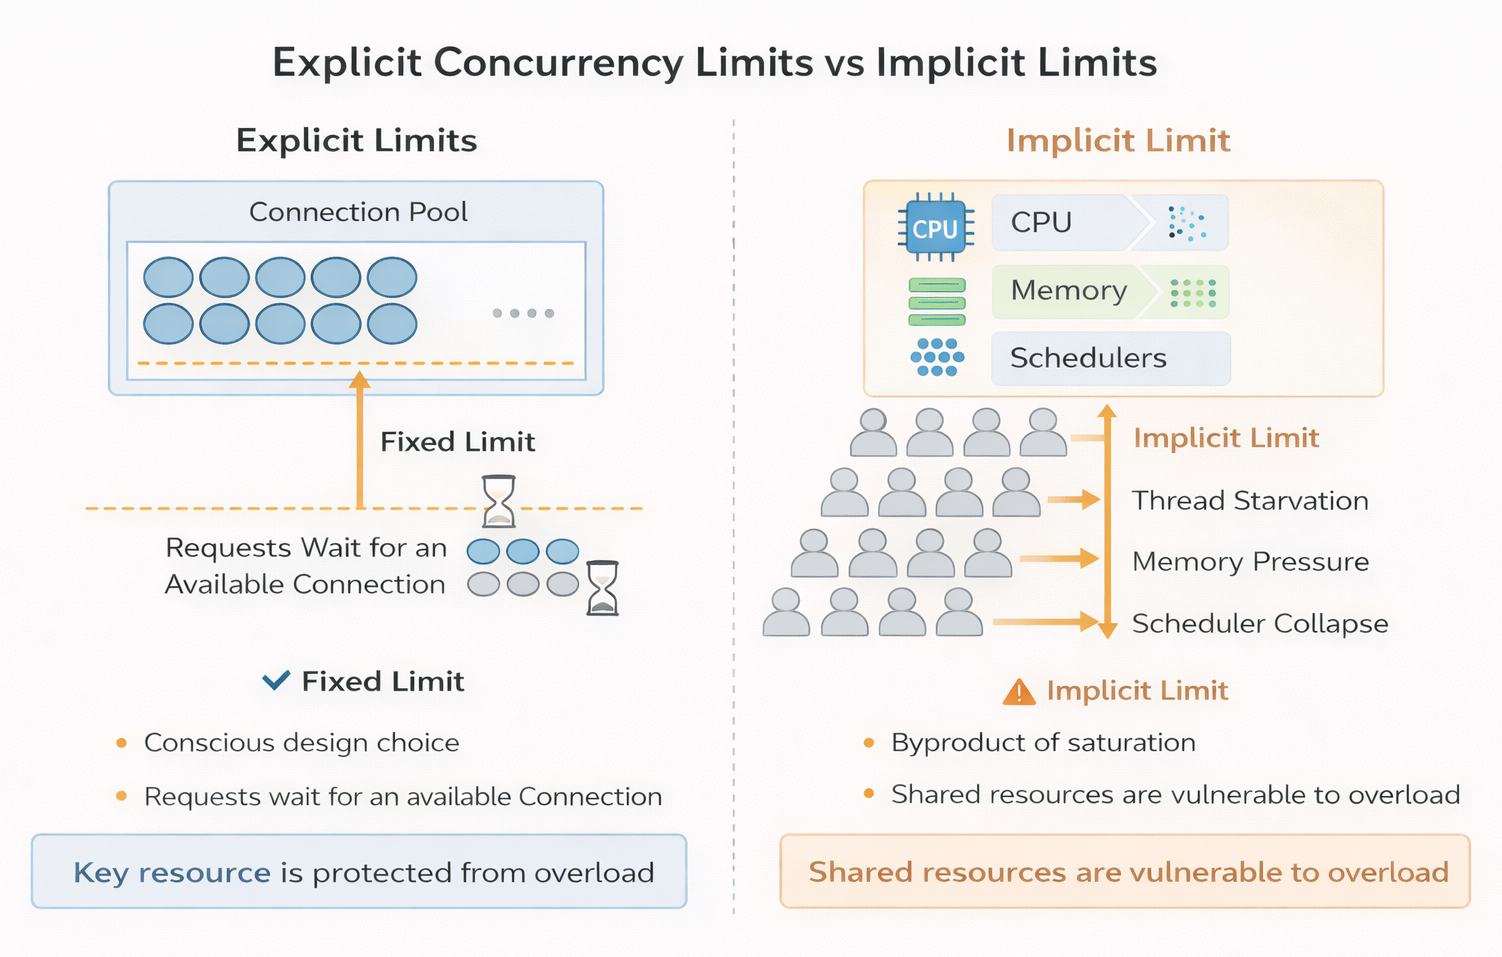
Some are chosen deliberately: connection pools, bounded queues, admission controls. Let’s call them explicit limits. Others arise indirectly: CPU saturation, memory pressure, scheduler contention. These are implicit limits.
From a systems-design perspective, these two categories behave very differently.
An explicit limit is a policy. It answers a clear question:
How much work are we willing to do at the same time?
When that limit is reached, the system makes a conscious decision—requests wait, are rejected, or are slowed in a defined way.
An implicit limit, by contrast, is not a decision. It is a consequence. CPU does not decide to shed load; it becomes busy. Memory does not reject work; it fills up. These limits reveal themselves only after pressure has already accumulated.
Both constrain throughput. Only one shapes behavior before the system is in distress.
Explicit limits describe what a system chooses not to do.
Implicit limits describe what it cannot do anymore.
Both constrain throughput, but only explicit limits shape behavior before the system is in distress whereas implicit limits reveal themselves after the pressure has accumulated in the system.
In the system we are studying, there is exactly one explicit concurrency limit: the database connection pool.
Everything else is allowed to grow until it collides with something physical, like a saturated resource (CPU, memory, etc.).
That choice is neither accidental nor unusual—but it has consequences.
How the Cache Enforces Limits — and How the Database Does
To understand the system’s behavior, it helps to start with the nature of the work each layer is designed to perform.
A cache exists to answer questions quickly. Its typical operation is simple: check for a value, return it if present, otherwise step aside. Cache work is intentionally small, short-lived, and independent. One request rarely interferes with another. The cache is optimized for speed, not coordination.
Because of that independence, concurrency is usually benign at the cache layer. Handling ten requests at once is not qualitatively different from handling one. There is little shared state to contend over, and little reason for requests to block one another. Ten requests may consume more resources than one, but the coordination overhead (avoiding deadlocks, preventing data inconsistencies, etc.) is far lower in a cache than in a database.
Concurrency issues can still arise, but they are usually treated as application-level concerns, not core cache responsibilities. Cache designs avoid built-in coordination to keep operations fast, stateless, and independent. When coordination is required, it is typically added explicitly outside the cache, usually at the application layer.
Caches still have limits, but they are enforced indirectly. Threads, CPU, memory, and network bandwidth constrain how fast the cache can respond. When those limits are approached, requests may slow down or fail fast—but they are not typically held for long. Pressure is shed rather than accumulated.
The database is built for a very different kind of work.
Database operations interact with shared, mutable state—data, transactions, and other coordination structures. Even simple reads participate in coordination through locks, buffers, indexes, and transactional guarantees. Requests are no longer independent. As a result, databases require built-in concurrency control to prevent double writes, inconsistent data states, data loss, and deadlocks.
Beyond a certain point, more concurrency does not increase throughput; it reduces it.
Because of this coordination overhead, concurrency must be controlled deliberately.
Databases cannot rely solely on CPU or memory exhaustion to signal overload without entering unstable regimes—where contention, coordination overhead, and internal blocking grow faster than useful work.
In these states, throughput drops and latency increases sharply even though physical resources are not fully consumed.
For this reason, databases use an explicit control mechanism in the form of a connection pool. The connection pool imposes a deliberate concurrency limit, deciding how many operations are allowed to execute at the same time.
As concurrency rises, coordination costs can grow faster than capacity, and throughput can peak earlier than expected. This is why databases enforce explicit concurrency limits: not because they are slow, but because correctness and performance degrade beyond a safe concurrency window.
Concurrency control at the database layer must therefore be proactive, not reactive. Once too many requests are already inside the system, it becomes difficult to regulate them cleanly.
When those limits are reached, requests do not merely slow down. They wait.
That waiting is intentional, but it is also costly. By the time a request is waiting for a database connection, it has already traveled through multiple layers of the system. It may be holding memory, execution context, and application threads. As waiting accumulates, pressure compounds. Latency stretches, retries amplify load, and failure modes become nonlinear.
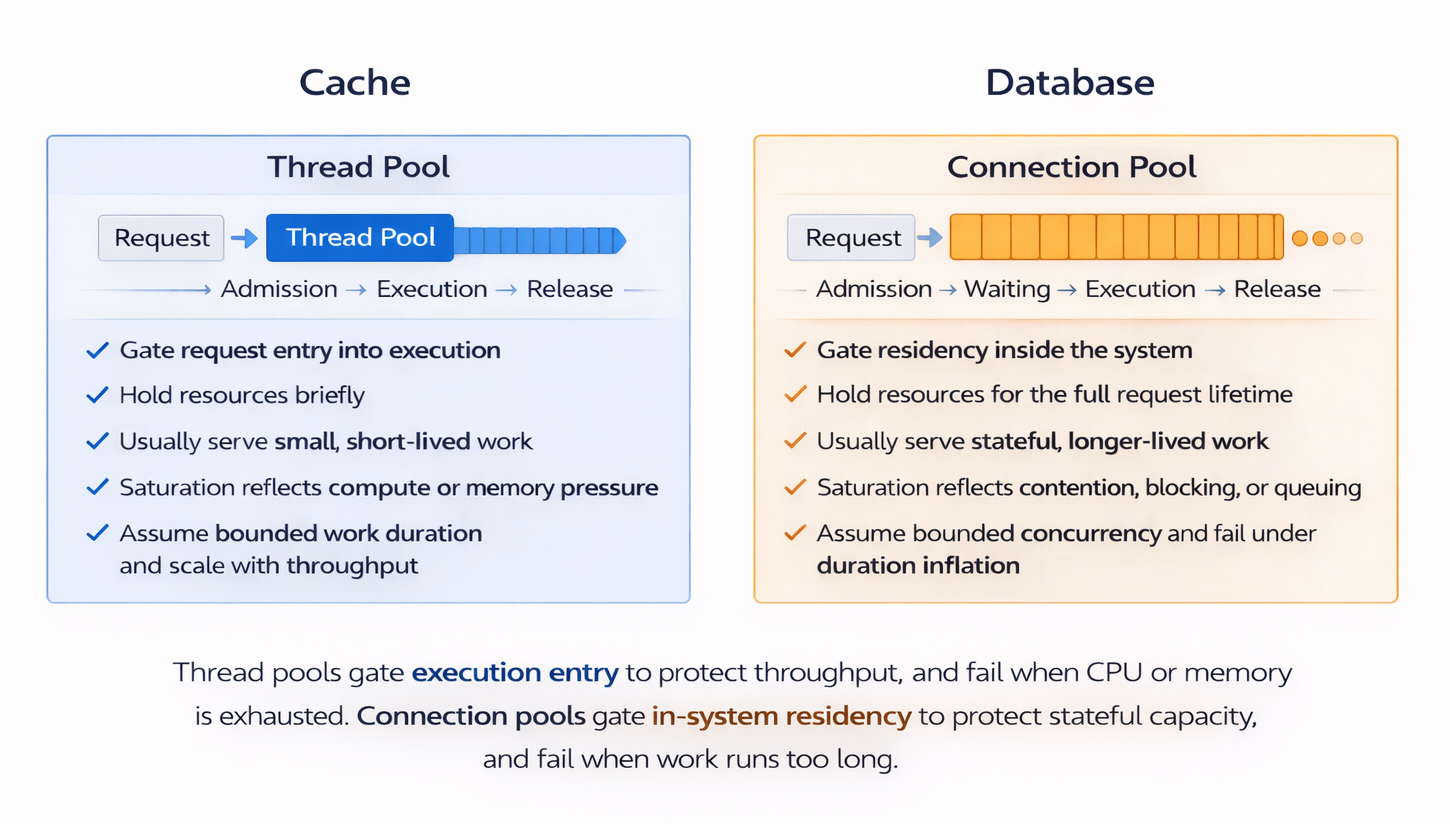
Concurrency limits in a cache emerge indirectly through resource exhaustion and thread pools. In a database, concurrency is imposed explicitly through a connection pool.
Thread Pools Versus Connection Pools
-
Thread pools
- Control how requests are allowed to enter execution
- Hold resources briefly
- Apply pressure early, before work has accumulated
- Waiting is shallow and usually self-correcting
- Typically bottleneck when CPU, memory, or downstream calls are saturated
-
Connection pools
- Control how many requests are allowed to remain in execution at a time
- Hold scarce resources for the full duration of execution
- Apply pressure late, after requests have already entered the system
- Waiting accumulates deep in the request path
- Can bottleneck simply because concurrency has been capped
-
In general:
- Thread pools reflect what the system cannot do anymore
- Connection pools reflect what the system chooses not to do
Systems become fragile when most concurrency control happens only after work has already entered the system.
4. A Small, Ordinary Disturbance
Up to this point, everything we have described lives comfortably in steady state.
Traffic is stable.
Capacity is unchanged.
The cache is effective.
The backend is quiet.
To move beyond that calm, we introduce a change—but not one that looks like a failure.
The Change: A Read-Path Version Shift
At some point during normal operation, the application begins reading data using a new cache key format.
Concretely, imagine the system previously cached user profiles under keys like:
key = "user:123:profile:v1"
value = { ... serialized user profile ... }
As the system evolves, a small, reasonable change is made. Perhaps a new field is added to the response, or the serialization format changes. To avoid mixing old and new data, the cache key is versioned:
Updated key = "user:123:profile:v2"From the application’s perspective, this is a safe and well-understood practice. Old keys are left intact. No data is deleted. The cache itself remains healthy and fully available.
At this point, a natural question arises: why not pre-warm the new keys before rolling out the change?
In practice, this is often not done. Pre-warming requires predicting access patterns, duplicating write load, and coordinating deployment timing — all of which add operational complexity. Many teams rely on the cache to warm naturally under real traffic, especially when the change appears small and low-risk.
From the cache’s perspective, something fundamental has changed.
Keys that were previously hot (frequently accessed) — user:123:profile:v1 — are no longer read at all. New keys — user:123:profile:v2 — start completely cold (not present in cache). For a period of time, every request that previously hit the cache now follows the miss path.
Nothing expired.
Nothing restarted.
The cache did not lose data — the application stopped asking for it.
What Changes — and What Does Not
From the outside, the system looks unchanged. Traffic remains steady.
Incoming request rate remains steady throughout the disturbance. No traffic spike, burst, or external surge is involved — the system starts to fail under the same load it previously handled without issue.
(Simulation details and setup available on GitHub - https://github.com/kramankishore/cache-containment)
What does change is the effective keyspace.
Requests that were previously served from cache now map to keys the cache has never seen. For a period of time, most requests follow the miss path. The cache still exists, but it is no longer absorbing traffic.
This coordination is not orchestrated by design. It emerges because many requests now share the same absence: their keys are cold.
A large amount of traffic that was previously absorbed by the cache is now passed through to the database.
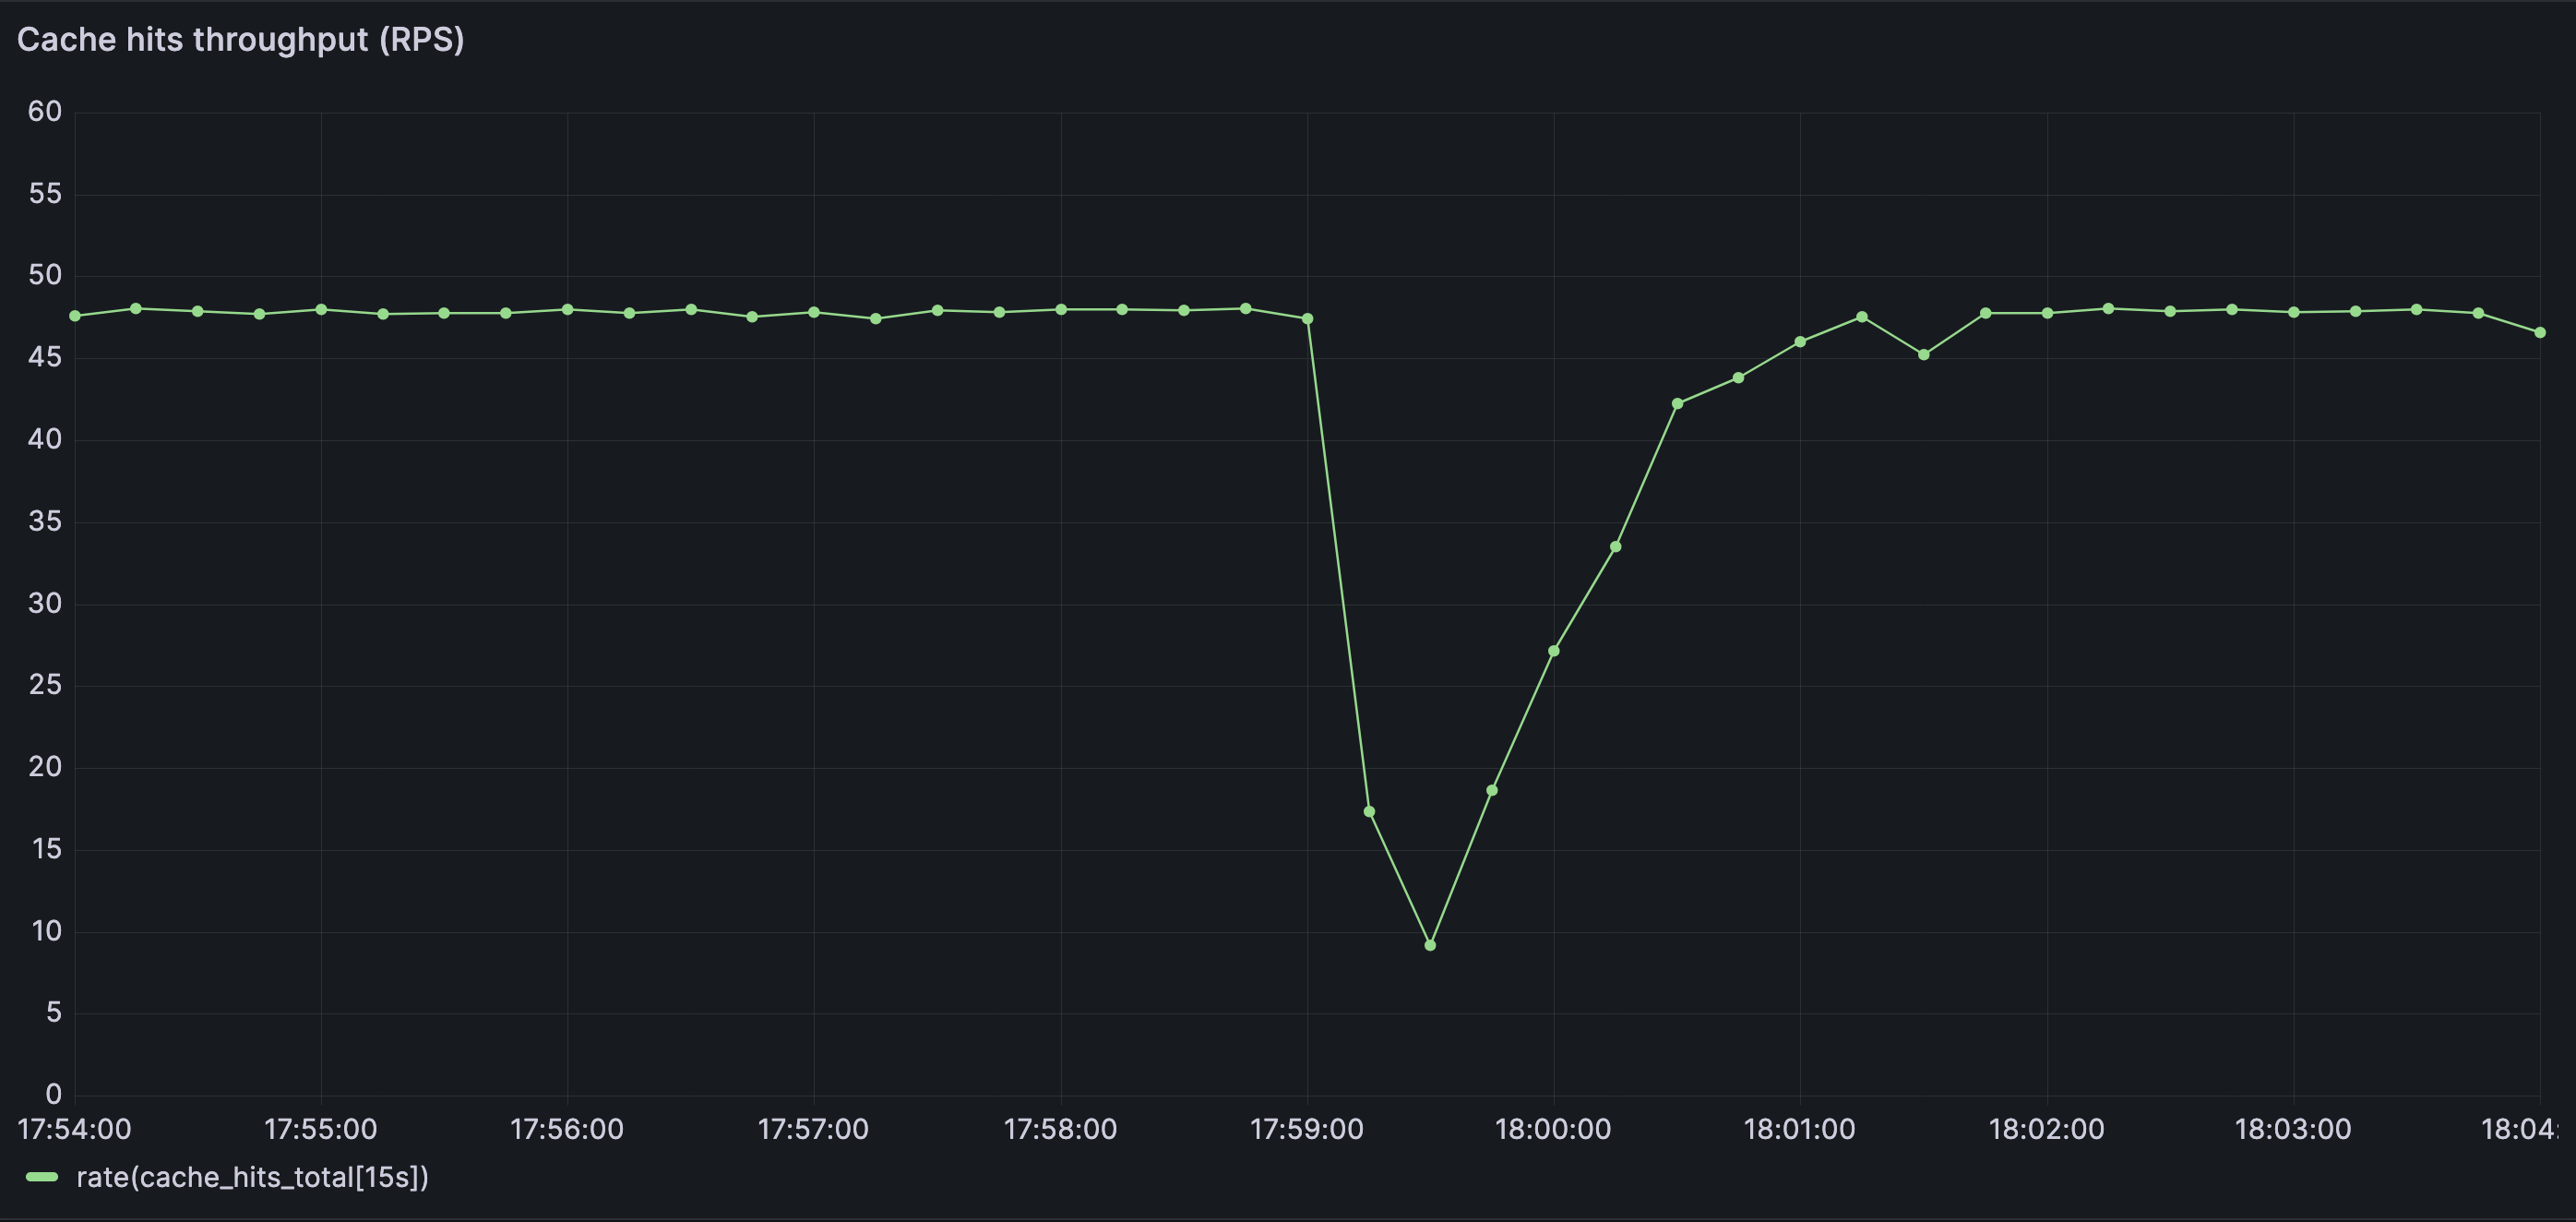
Cache hit throughput collapses abruptly after the read-path change. A large fraction of requests that were previously served from memory now fall through to the database simultaneously.
Cache effectiveness depends not just on capacity,
but also on how consistently the same reads flow through it.
Why This Is an Ordinary Event
Read-path versioning is not an edge case. It is a routine part of evolving systems.
And it is not the only way the same effect appears.
The very same pattern — coordinated cache misses without a traffic spike — also emerges when:
- clients begin requesting additional fields after a UI change
- feature flags alter which data is fetched
- experiments introduce new cache key dimensions
- user behavior shifts into a colder region of the keyspace
In all of these cases, the cache infrastructure remains healthy. The request rate remains steady. What changes is which keys are being exercised.
The consequence is the same: a sudden increase in pass-through traffic to the backend.
When a Steady-State Assumption Breaks
In steady state, cache misses are time-distributed. They arrive independently, and the backend absorbs them smoothly.
After the read-path shift, that assumption no longer holds.
The requests themselves are still independent. What changes is when they arrive. Misses that were previously spread out now occur together. A non-steady-state transition breaks the time distribution the system quietly relied on.
Cache misses occur even in steady state (due to TTL expiry or new entries being added), but they are spread out in time. In this case, the cache misses become coordinated, and many of them occur at once.
No capacity threshold has been crossed.
No component has failed.
But the system is no longer operating in the regime its design implicitly assumed.
Steady-state behavior makes systems look safer than they are.
Transitions expose the assumptions that steady state quietly relies on.
What the System Does Next
Once cache misses arrive in a coordinated wave, work that was previously absorbed by the cache now passes straight through to the backend.
Database concurrency rises quickly.
The connection pool fills, and requests begin to wait for a connection.
The system is not seeing more traffic.
It is seeing more work per request.
Waiting begins as the connection pool saturates.
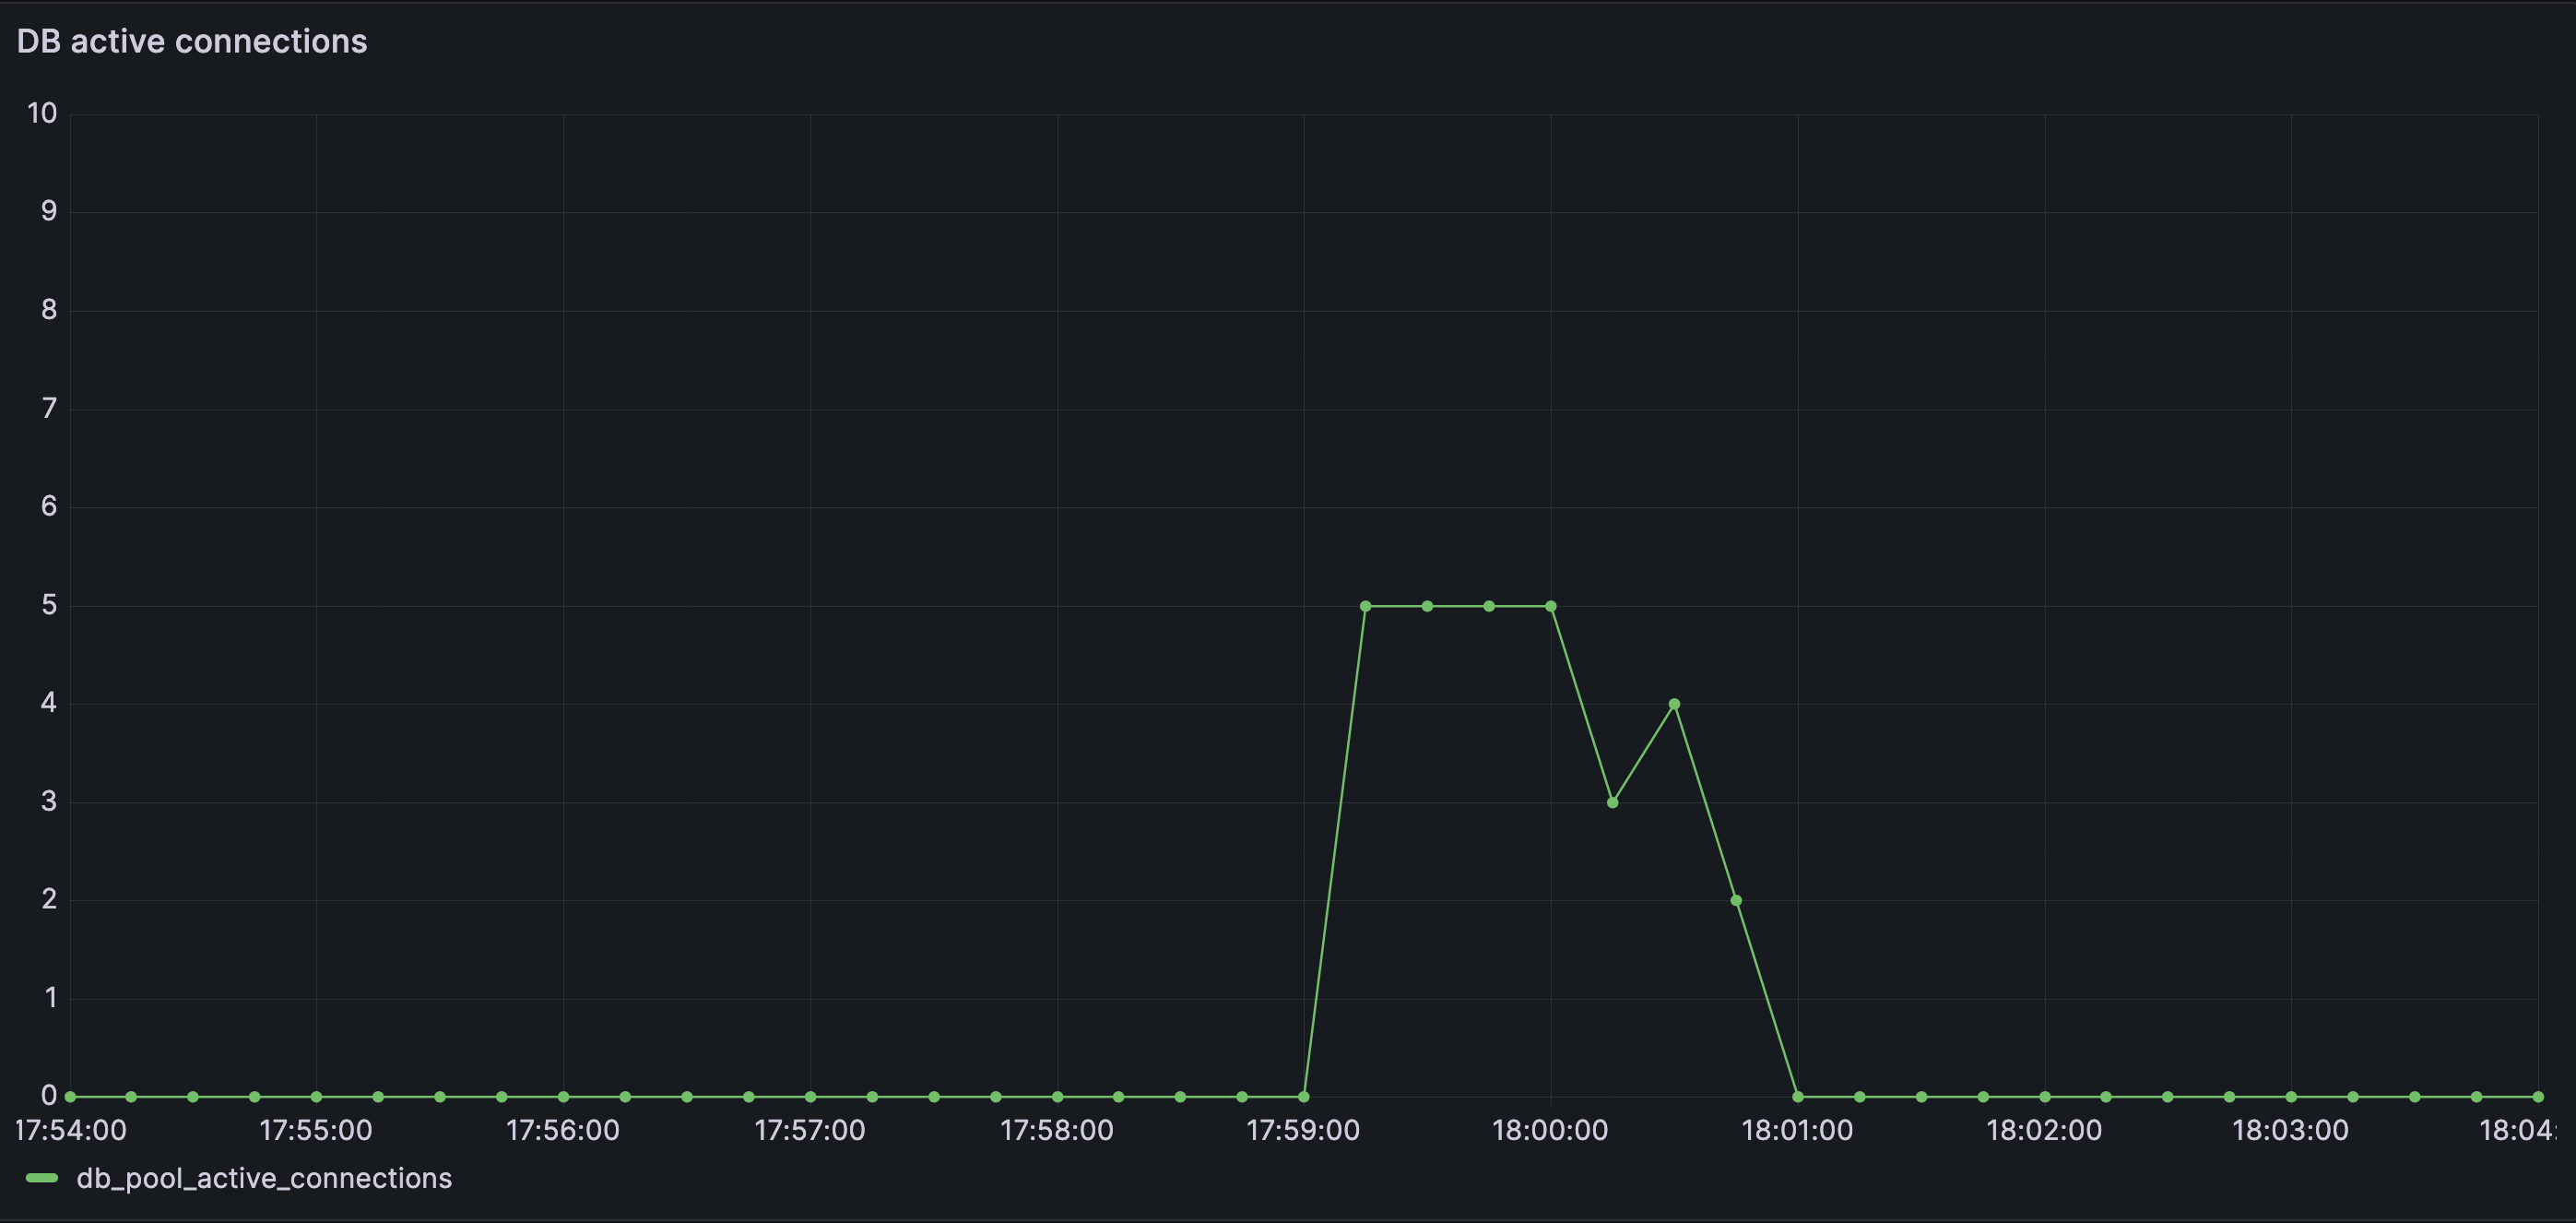
Database active connections spike and saturate quickly as cache misses fan out into concurrent downstream work. The database becomes the first visible bottleneck, despite no change in incoming traffic.
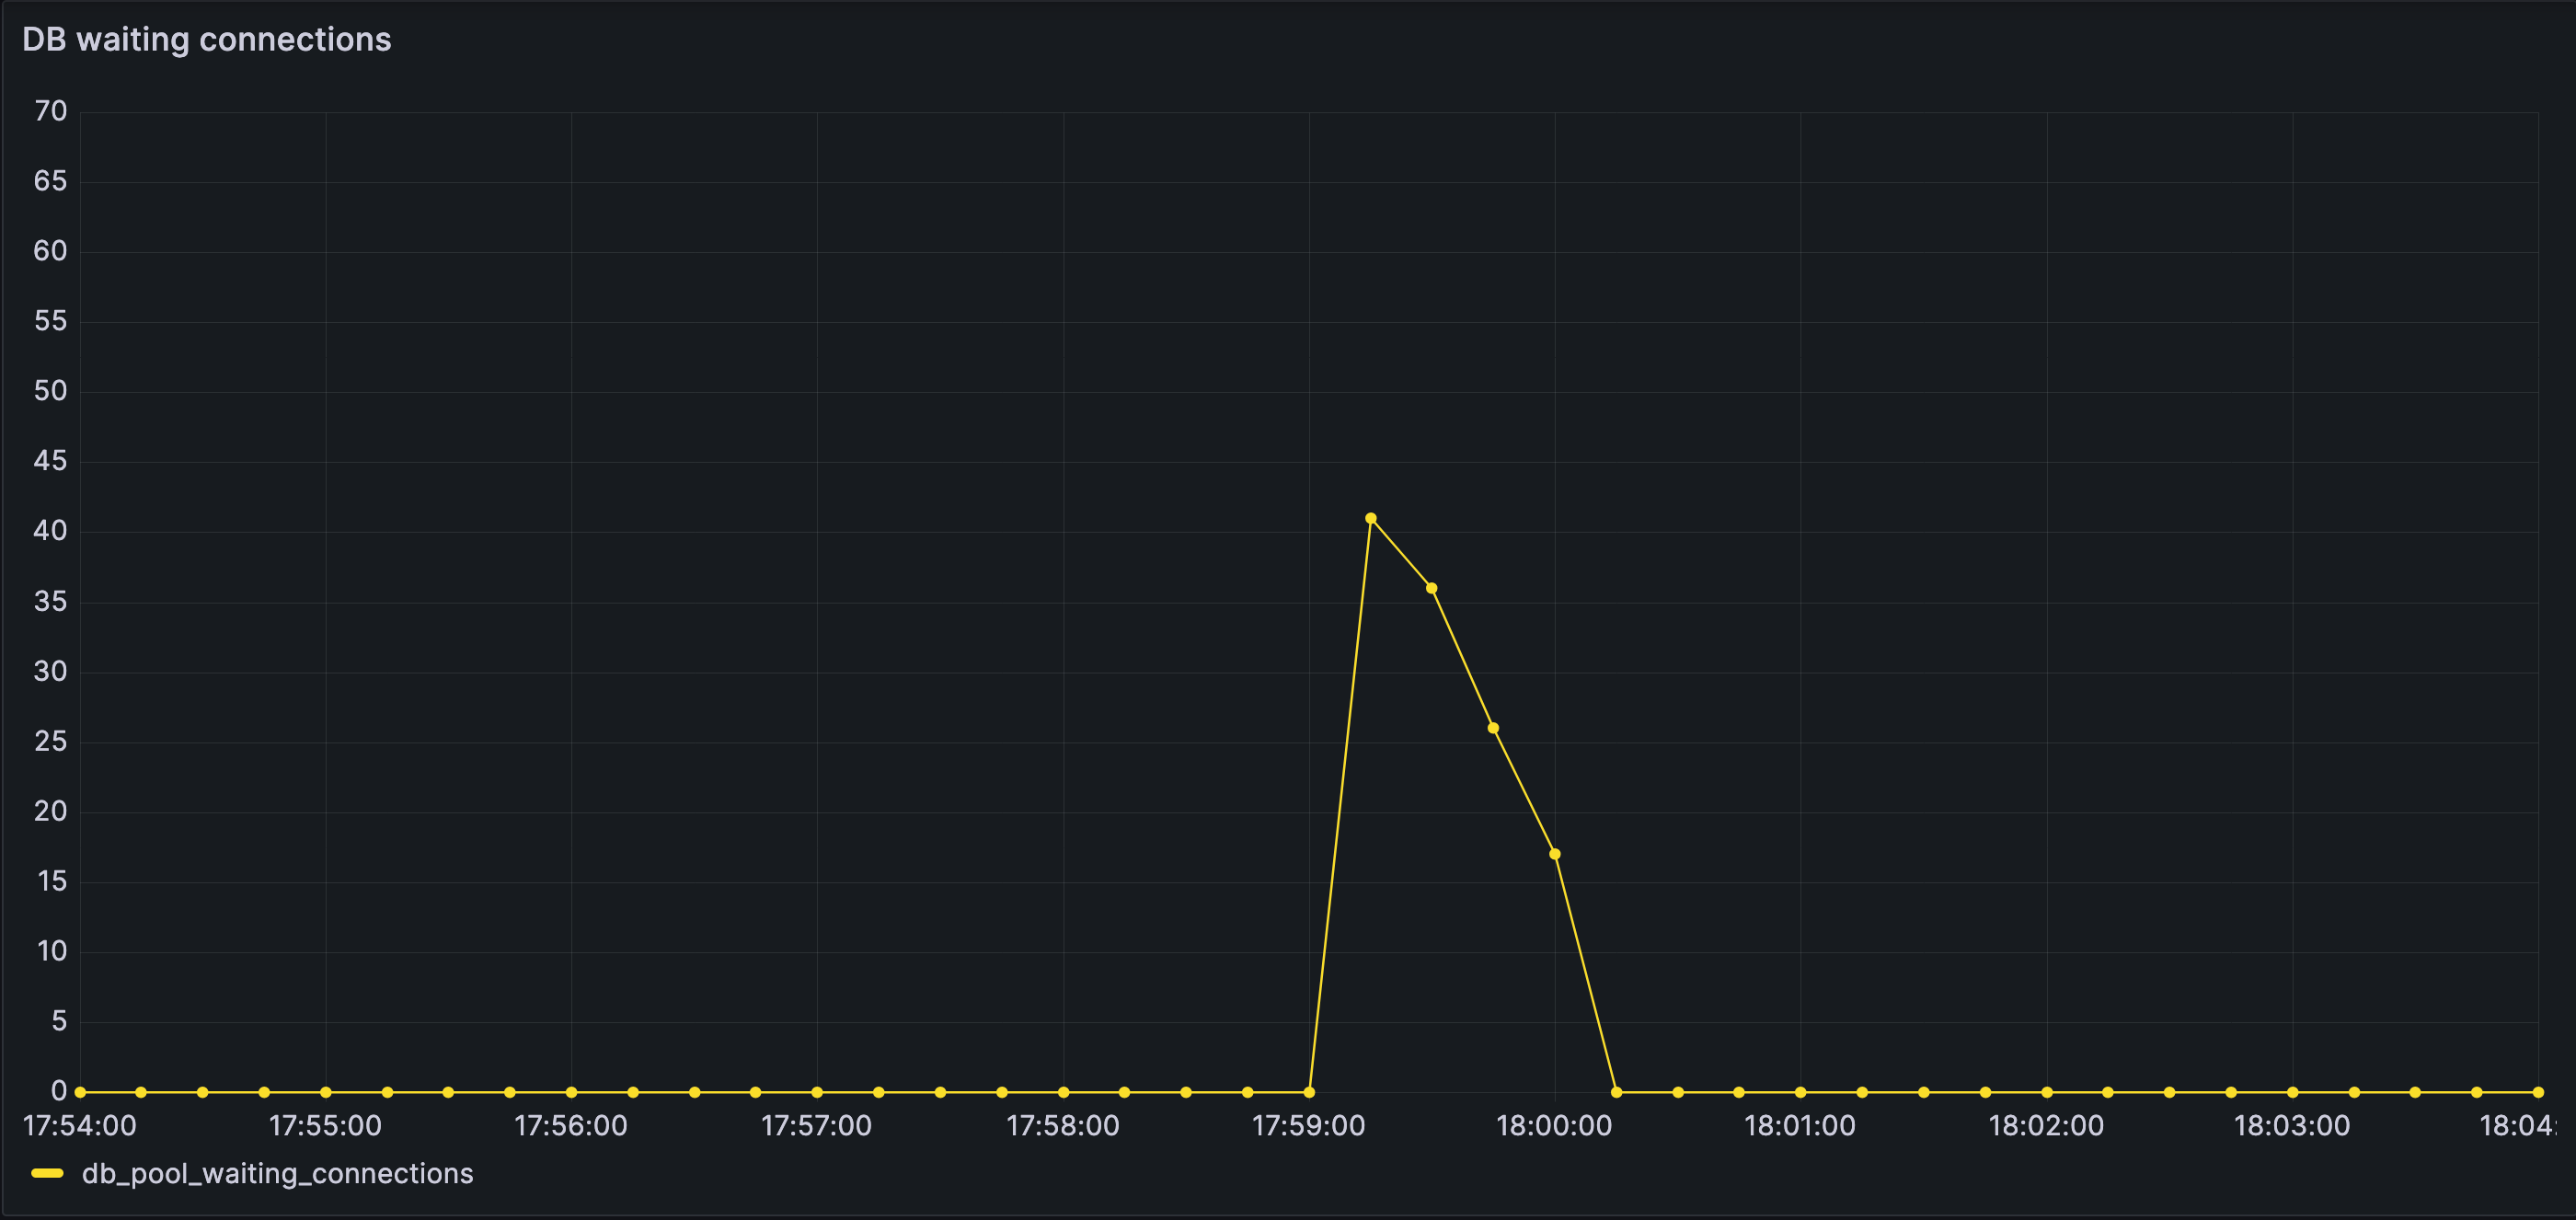
Waiting database connections accumulate quickly once the connection pool saturates. Work is no longer progressing — it is queueing, silently and expensively, inside the database layer.
As wait times grow, some requests cross the connection-acquisition timeout and are rejected.
This is the first failure that has emerged.
Failures surface not because the database is slow, but because it is deliberately refusing to admit more concurrent work (explicit concurrency control).
At the same time, latency metrics become misleading.
One might expect latency to increase dramatically. It does not. The increase is relatively small.
Requests that fail early exit quickly, so the observability charts show only a slight latency increase.
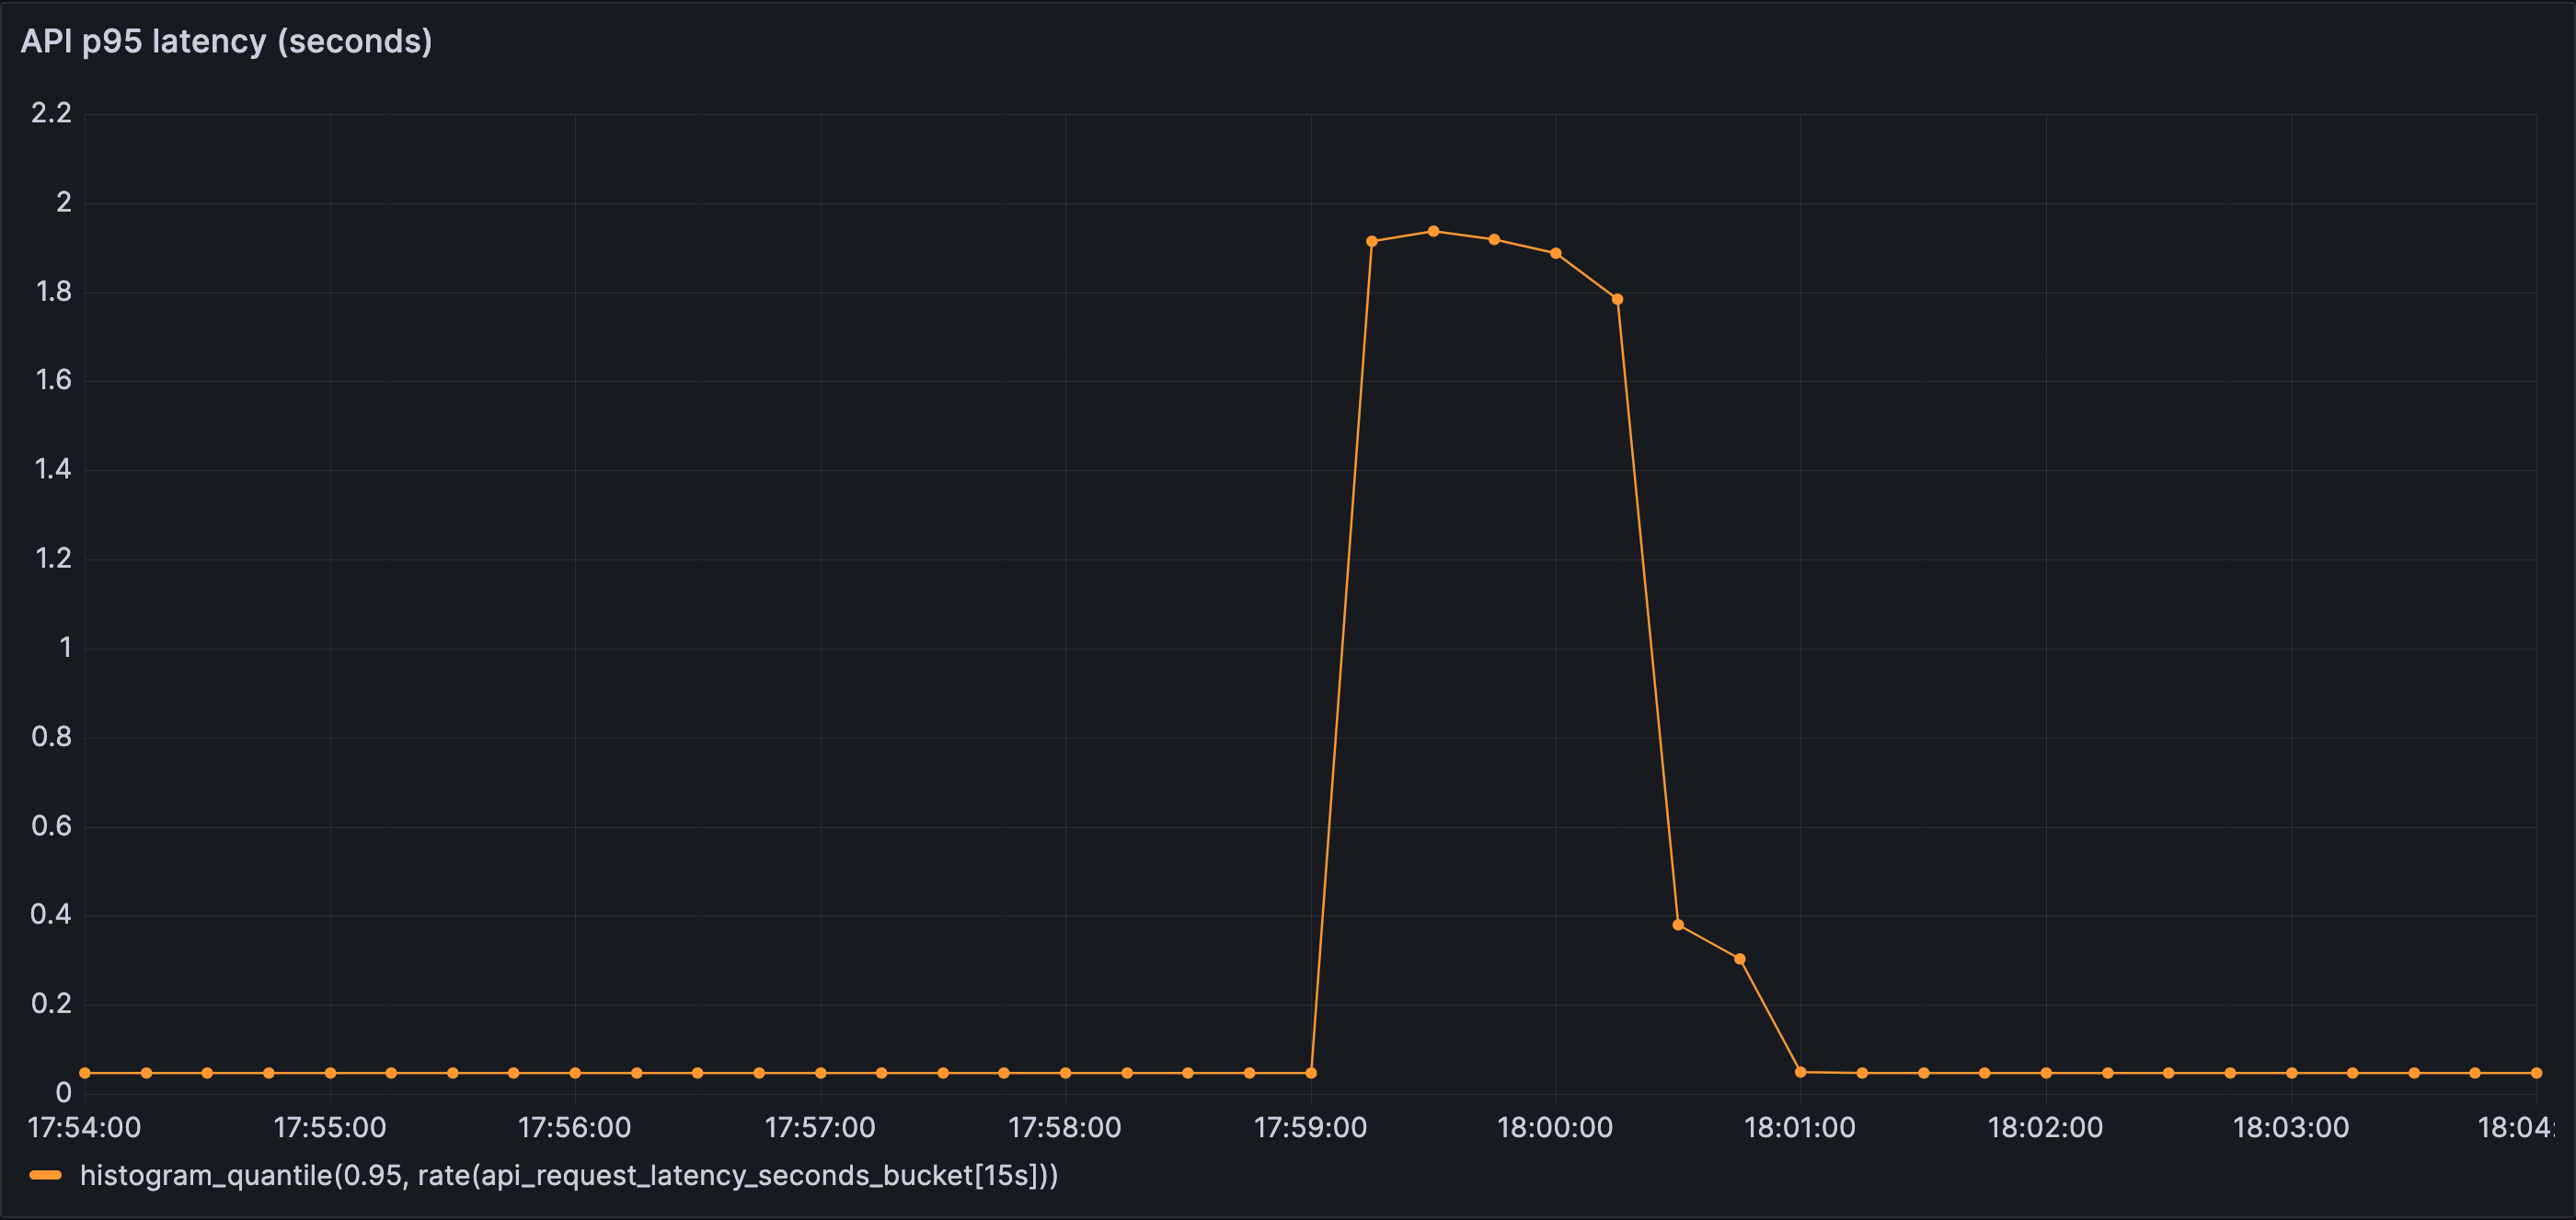
Tail latency increases, but not dramatically. Most requests are not slow — they are timing out or failing before completing, masking the severity of the underlying contention.
But the error rate chart reveals the truth as the failures rise.
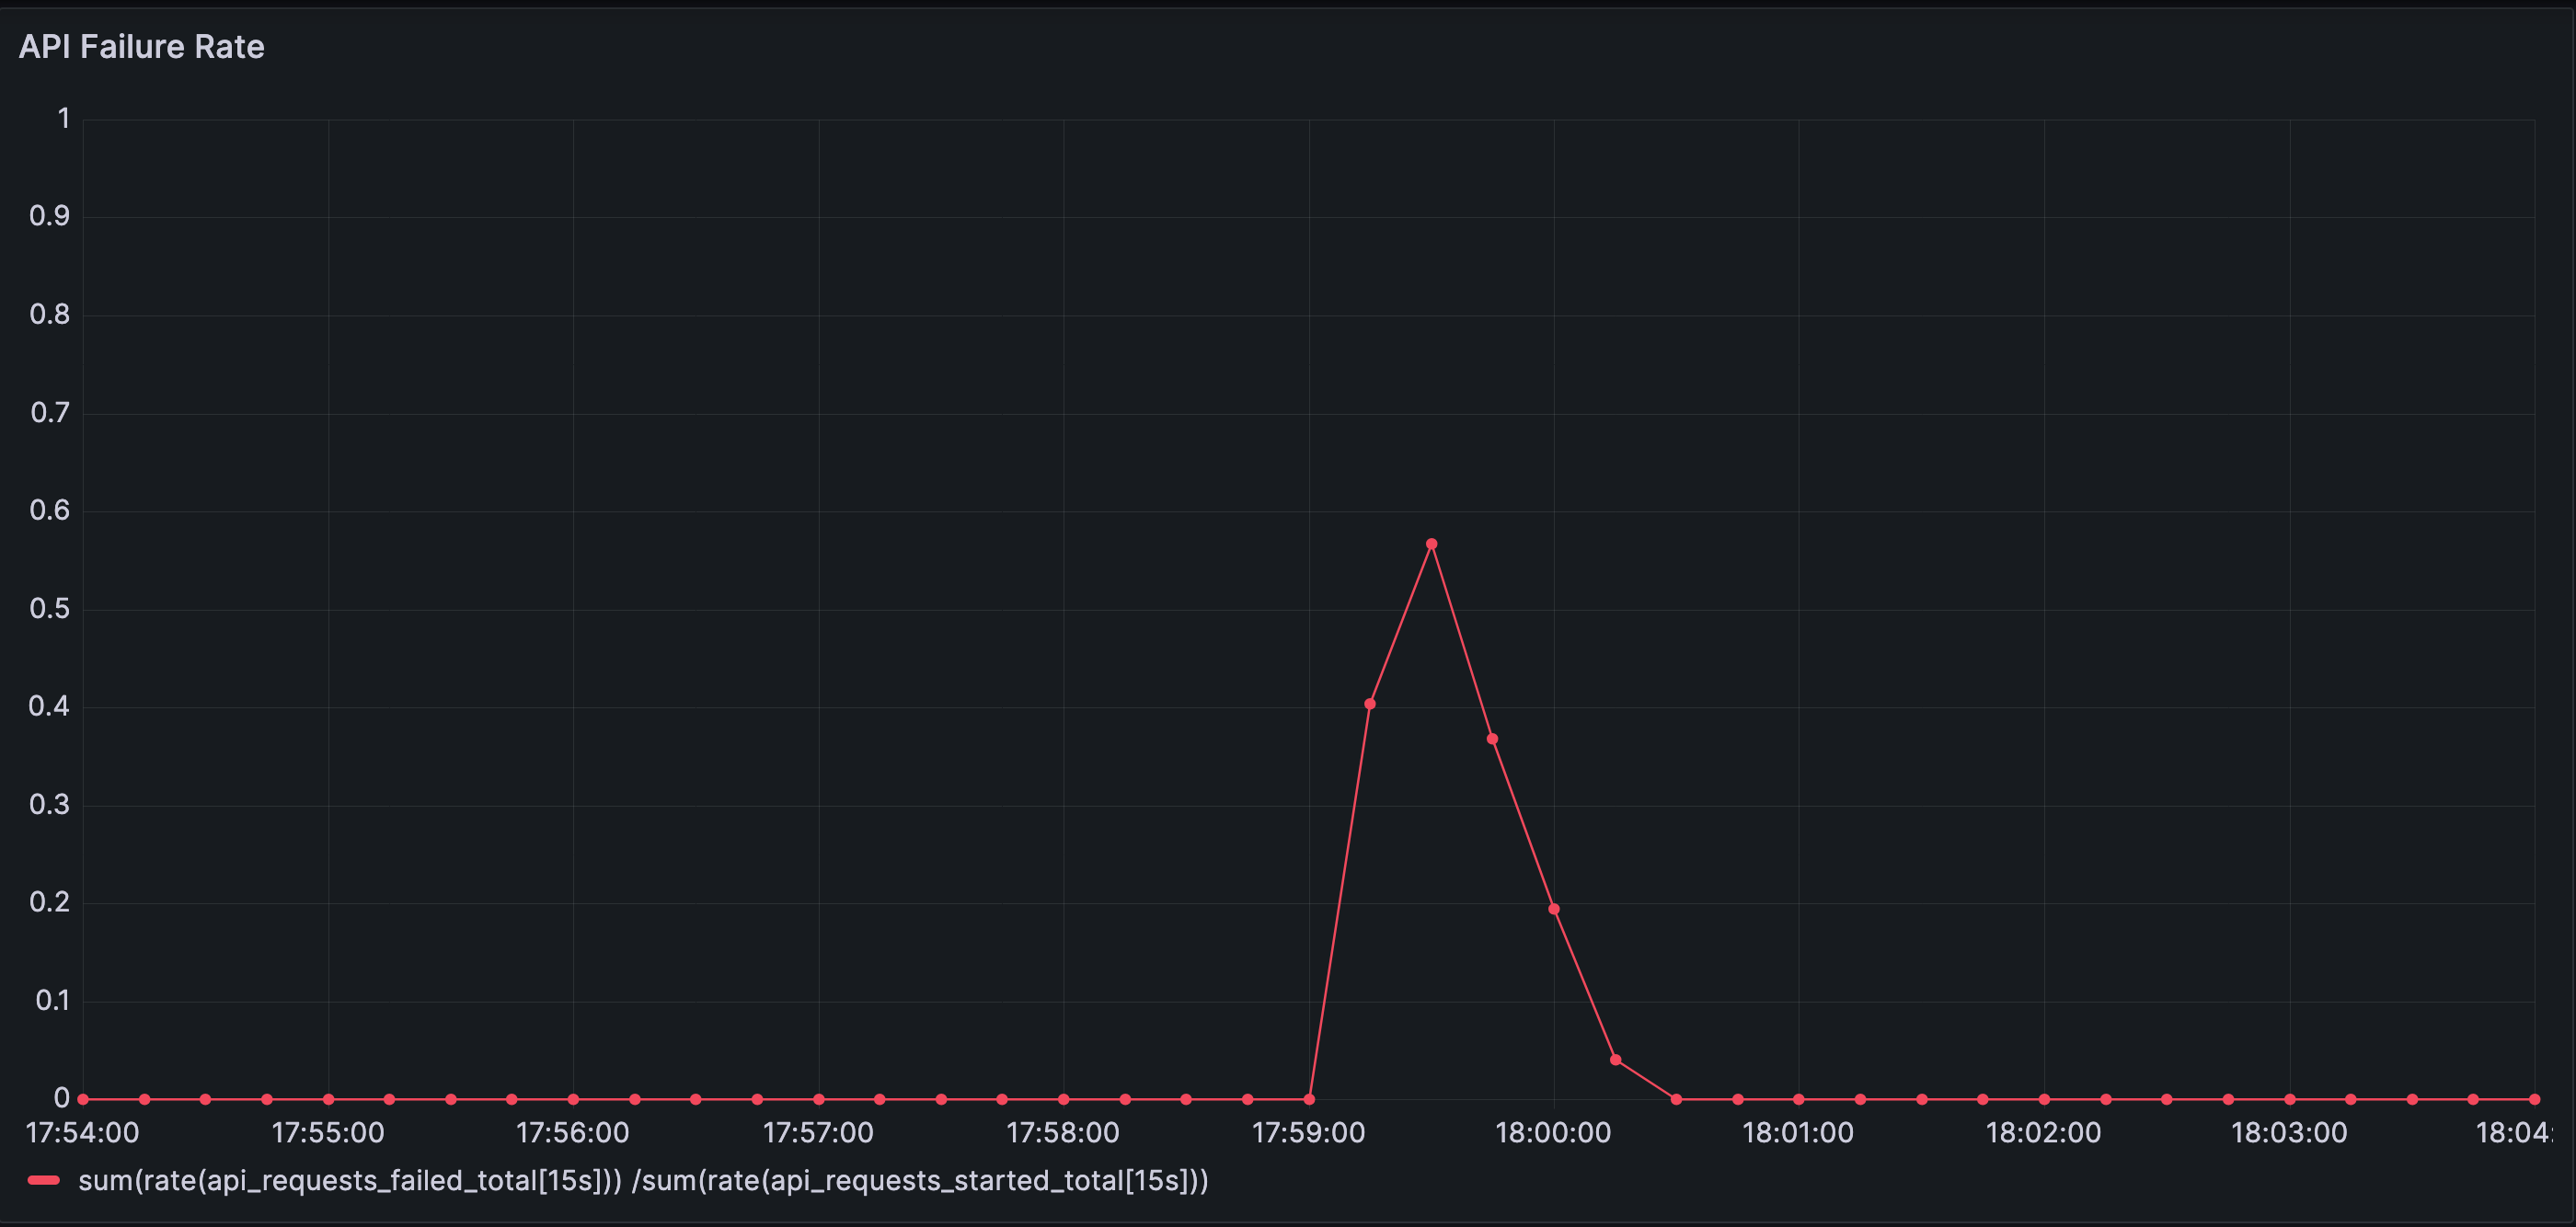
Error rate spikes sharply, peaking around 60%. Requests fail not because the system is overloaded by traffic, but because waiting has propagated into a layer with hard limits and timeouts.
From the outside, the signals look contradictory. Inside the system, nothing unusual is happening. Each component is behaving exactly as designed.
All components in the system are functioning as designed.
Traffic remains unchanged.
And yet, a failure mode emerges.
Systems do not fail only when components break or traffic increases.
They also fail when behavior crosses an unseen boundary.
5. When Waiting Moves Upstream
The database is now the point where waiting is accumulating.
This section shows how unresolved waiting propagates upstream—and why that propagation, not load, is what ultimately destabilizes the system.
How Waiting Propagates Upstream
Once all database connections are in use, any request that needs the database cannot make progress. It waits. But that request is not isolated. It is usually holding execution resources while it waits—an application thread, an async task slot, a request handler, or an event-loop callback.
Now consider a simple chain:
A request waits for a database connection.
Another piece of work waits for that request to complete.
Soon, many requests are waiting on the same blocked point.
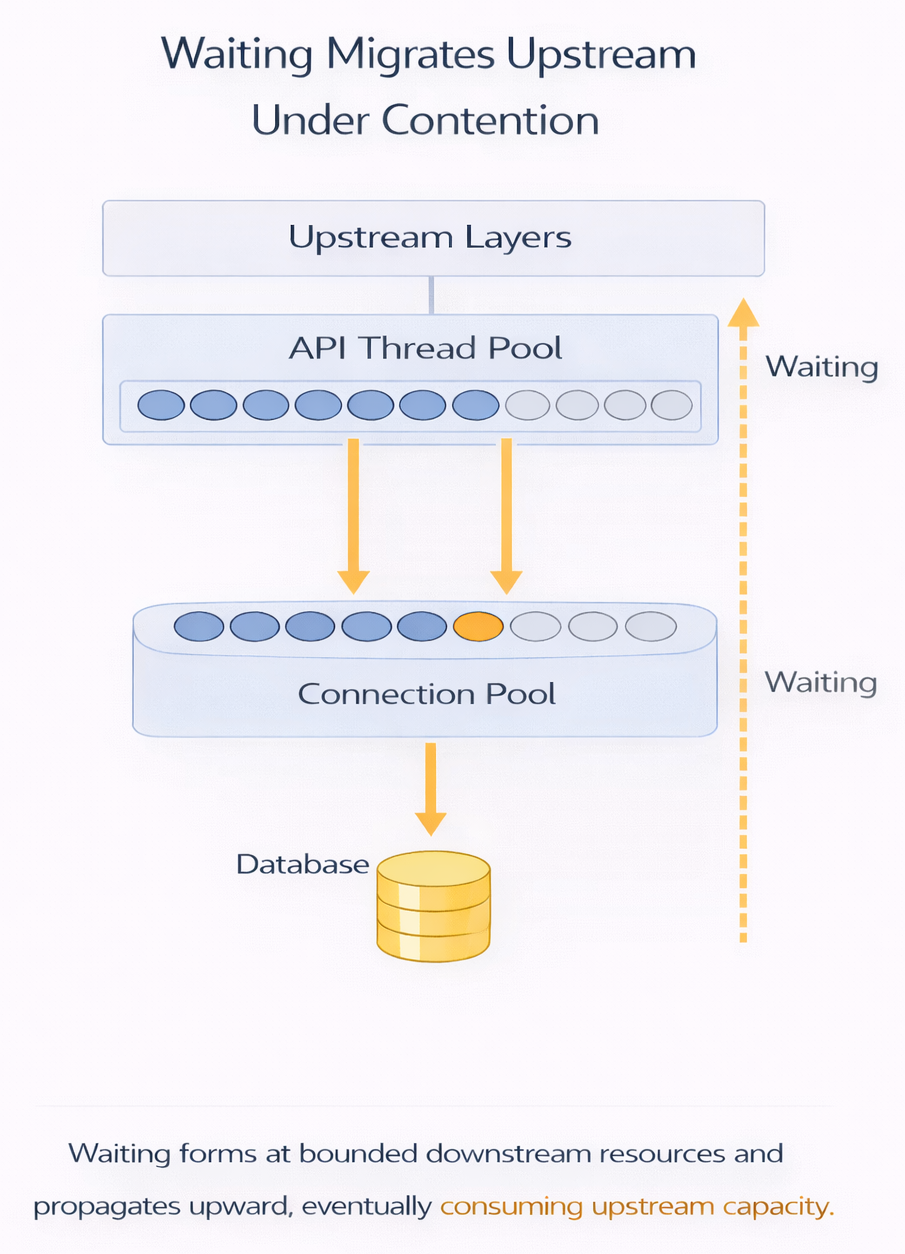
Waiting propagates upstream.
What started as waiting at the database becomes waiting before the database — even for work that never needed the database at all. Threads pile up. Schedulers back up. Event loops slow down. Work that never needed the database now waits behind work that does.
Waiting does not remain local.
When it cannot be resolved at one layer, it propagates upstream, causing cascading effects.
The propagation looks roughly like this:
Why This Was Hard to See Coming
Nothing in the steady-state metrics warned us about this behavior beforehand.
The cache looked healthy.
The backend looked underutilized.
Latency was stable.
The explicit concurrency limit worked exactly as designed.
What failed was the assumption that work would remain time-distributed.
A system can look healthy for months while being one transition away from a catastrophic failure mode.
Steady state hides failure modes that emerge from coordinated arrivals rather than sustained load.
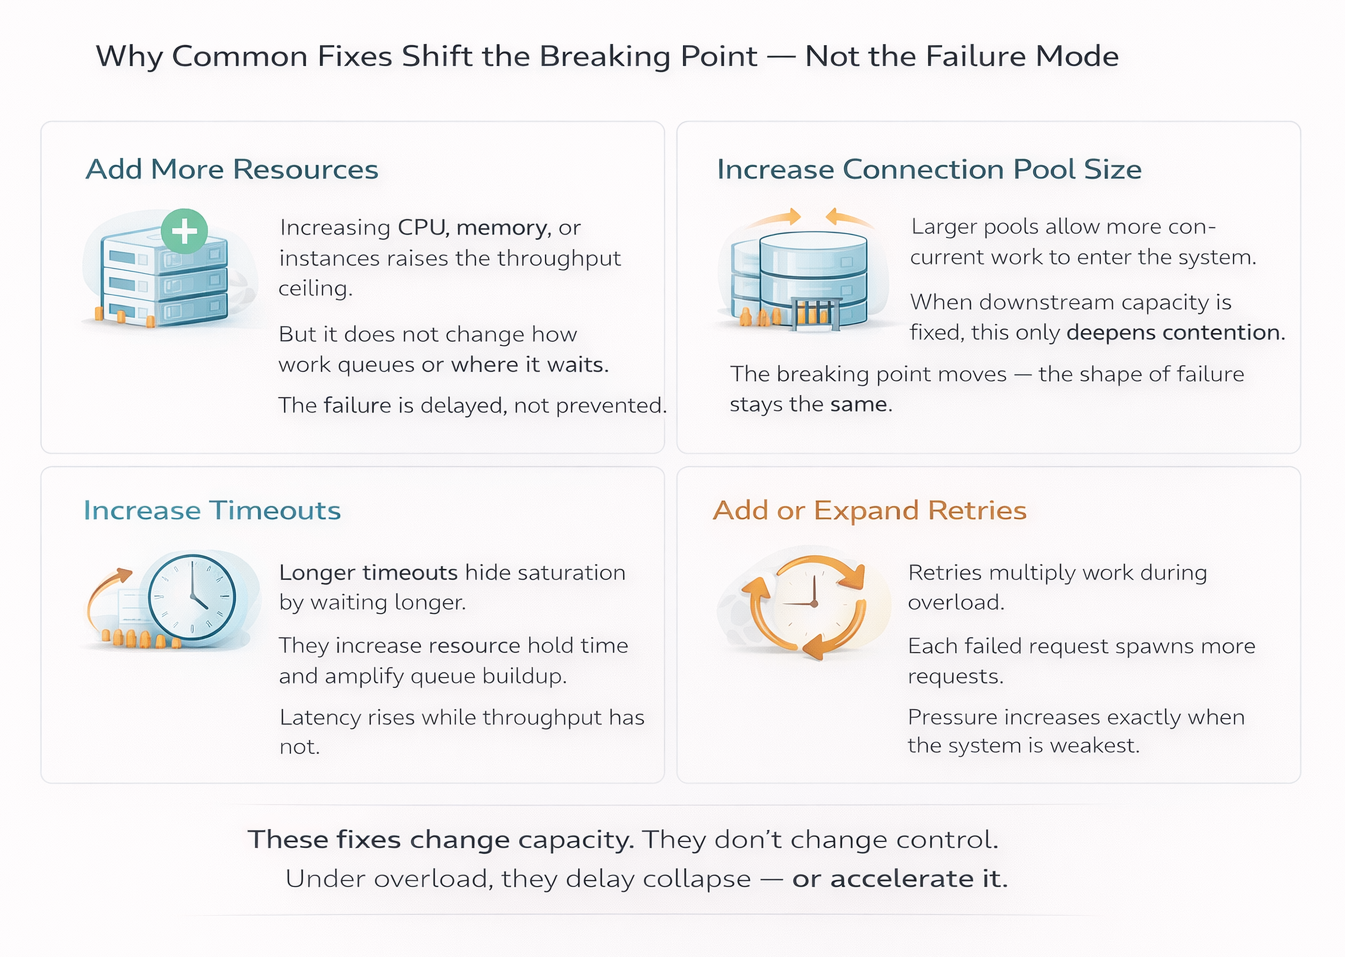
6. Why Common Fixes Make This Worse
When systems behave this way in production, the first responses are usually predictable:
- Increase resources
- Enable or expand retry logic
- Adjust timeouts
- Increase connection pool sizes
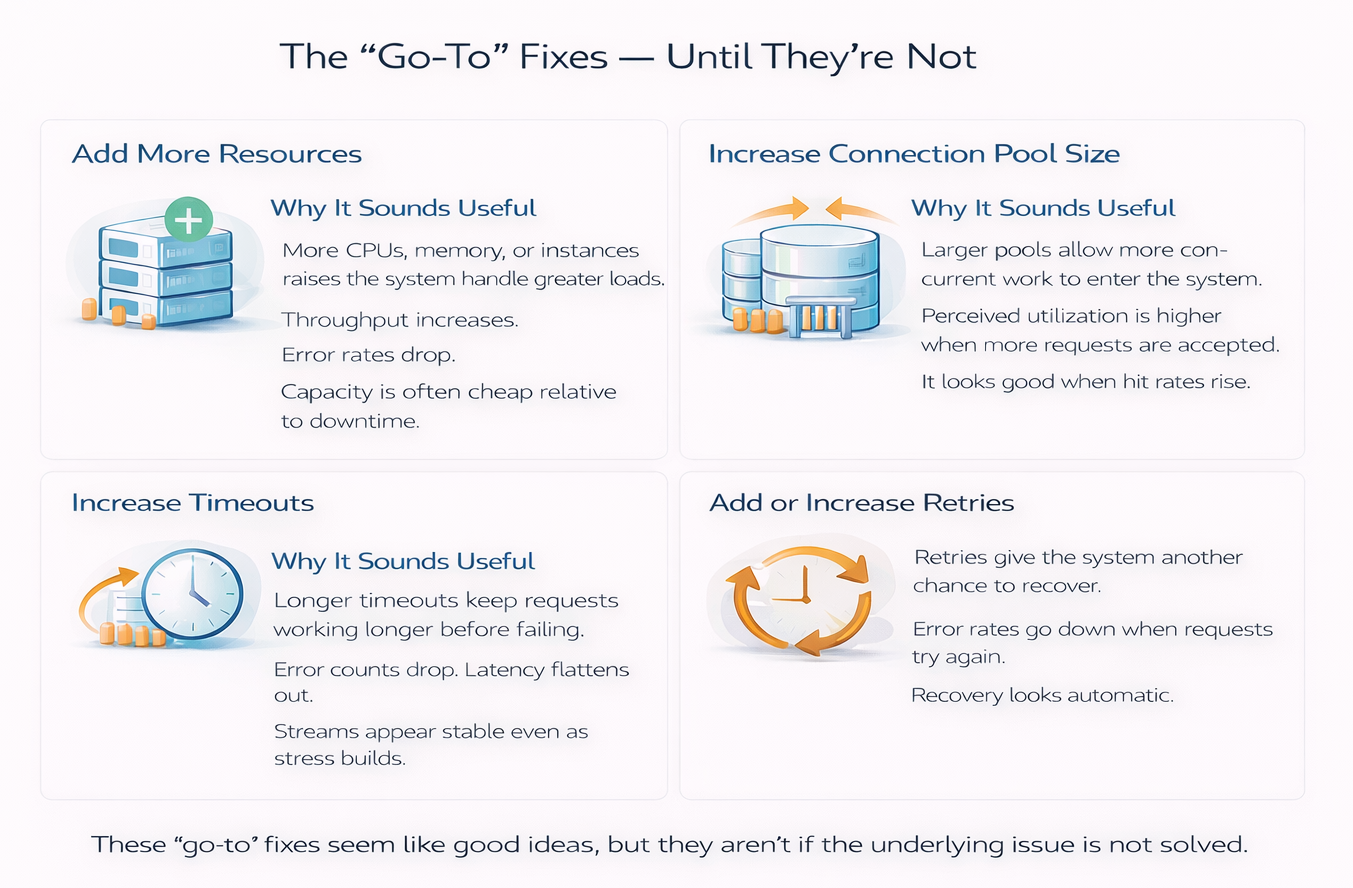
Common responses during incidents: add capacity, increase timeouts, expand retries, grow pools.
All of these changes feel reasonable. And all of them, in this situation, tend to make the system harder to reason about. Let’s discuss them below.
Why Scale Requires Regulating Bursts, Not Just Capacity
It is tempting to look at what happened and conclude that the database needed more resources.
The pool saturated.
Requests timed out.
Throughput dropped.
But this is not a failure of steady-state capacity.
If cache misses had continued to arrive independently—as they did before—the same database and the same pool size would have handled them without issue. The system has already demonstrated that it can sustain this workload.
What changed was not how much work the system could do, but how work arrived. The system encountered a traffic burst—not in overall request volume, but in pass-through work due to coordinated cache misses occurring at the same time.
Adding more database capacity would raise the threshold at which failure appears, but it would not change the nature of the failure. A larger pool would absorb a larger burst—and then fail in the same way once that new limit is crossed. Waiting would still accumulate, and it would still propagate upstream.
At scale, systems cannot rely on capacity alone to absorb every burst. Resources are finite. Transition-driven bursts are not. Stability depends on shaping how work is admitted during those transitions, not just on provisioning for steady-state throughput.
The system did not fail because it lacked resources.
It failed because it admitted work faster than it could regulate.
Systems scale not only by adding capacity, but also by regulating traffic meaningfully.
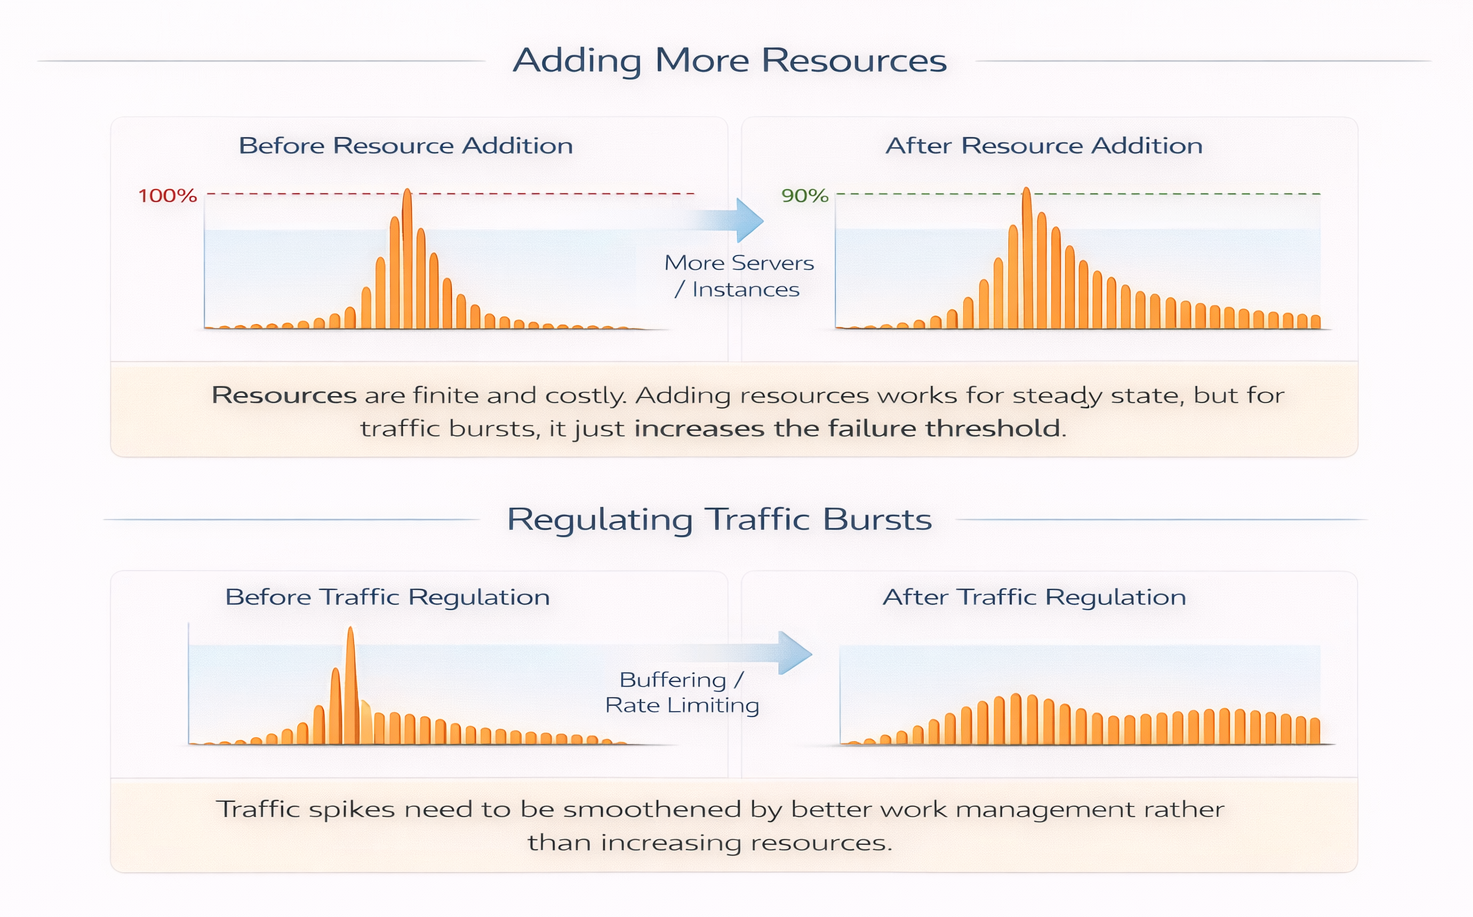
Capacity shifts the threshold of failure; it does not change the dynamics that cause it.
Retries Multiply Work Before They Relieve It
Will retries be helpful in such scenarios?
Retries are often added with good intent: to make systems more resilient to transient failures.
But retries are not neutral. They are a form of work multiplication.
Whether that multiplication helps or harms depends on why the original request failed.
Retries are safe when failure means work did not start.
They are dangerous when failure means work started but could not make progress.
Database connection timeouts fall into the second category.
If a failure indicates that a dependency is briefly unavailable—such as a dropped connection or a service restart—retrying gives the system another chance to do useful work once the transient condition clears.
If a failure indicates that work is already waiting behind a saturated limit, retrying only adds more work to a system that has not yet recovered. The retry joins the same backlog as the original request, increasing pressure rather than relieving it.
In this system, timeouts occur because requests are waiting for a database connection. Retrying does not change that condition. It amplifies it.
The important design question is not “Should this call be retried?”
It is “Does a failure here mean the system is unavailable, or merely congested?”
Retries help in the first case.
They hurt in the second.
In our case of coordinated cache misses, retries amplify the waiting at the database and compound the problem further.
Retries make systems more resilient to transient failures. But they multiply work as well.
Retries should be added where failure means no work was admitted, not where failure means work is already waiting or a resource is saturated.
Longer Timeouts Hide the Problem Without Solving It
Another common reaction to rising failures is to increase timeouts.
This often reduces visible errors. Fewer requests fail outright. More requests eventually succeed.
But nothing fundamental has changed.
Requests still wait.
Work is still admitted faster than it can be regulated.
The system is not healthier. It is simply quieter about its distress.
The reason is structural. Timeouts do not control how much work enters the system. They only decide how long admitted work is allowed to wait. When failures are caused by congestion rather than unavailability, extending timeouts keeps more work trapped inside the system, tying up threads, memory, and schedulers and delaying recovery.
This distinction matters while writing code.
A timeout makes sense when waiting is cheap and isolated—for example, waiting for a remote configuration fetch during startup, or for a leader election to complete, where no other requests are blocked and no scarce resources are held.
A timeout is risky when waiting blocks progress elsewhere—for example, waiting for a database connection while holding a request thread, or waiting on a downstream call inside a fan-out, where each waiting request prevents other work from starting.
In our case of coordinated cache misses, timeouts occur after requests have already entered the database admission path. Increasing timeout duration does not reduce pressure; it extends the time work remains stuck inside the system.
Longer timeouts trade fast failure for slow failure. They stretch incidents out in time and make recovery less predictable.
The right design-time question is not “Is this timeout long enough?”
It is “What is being held while this request waits?”
Timeouts are effective when waiting is cheap. They are dangerous when waiting consumes shared capacity.
Bigger Pools Move the Breaking Point, Not the Shape
Increasing the database connection pool is often framed as “adding capacity”.
In reality, it mostly postpones saturation.
A larger pool allows more concurrent work, but it does not address the lack of coordination upstream. When cache misses arrive in large groups, they will still fan out. They will simply do so against a slightly higher ceiling.
The system will fail later—but in the same way.
Increasing pool sizes changes when the system fails, not how it fails.
Why These Fixes Feel Right
All of these tools—capacity, timeouts, retries, pool sizing—operate after work has already been admitted.
They are reactive. They regulate execution once pressure is visible.
This makes them effective when load is smooth and failures are isolated. They help systems behave well in steady state and recover from small disturbances.
But they do not answer the question the system is now struggling with:
How much work should be allowed into the backend at once—especially during bursts?
When admission remains unconstrained upstream, transitions turn into coordinated bursts. Pressure migrates. Waiting propagates. Failures appear nonlinear and difficult to explain.
The issue is not that these tools are wrong.
It is that they act too late in the request path.
Stability depends on shaping admission — not just reacting to overload.
7. Cache Containment: Engineering Failure Modes Consciously
Up to this point, the system has behaved exactly as its structure allows.
Cache misses fan out freely.
Concurrency is constrained only at the database.
Waiting migrates upstream.
Failures appear late and ambiguously.
What changes the system’s behavior is not making the database faster, nor increasing capacity, nor adding smarter retries.
It is changing where work is allowed to queue.
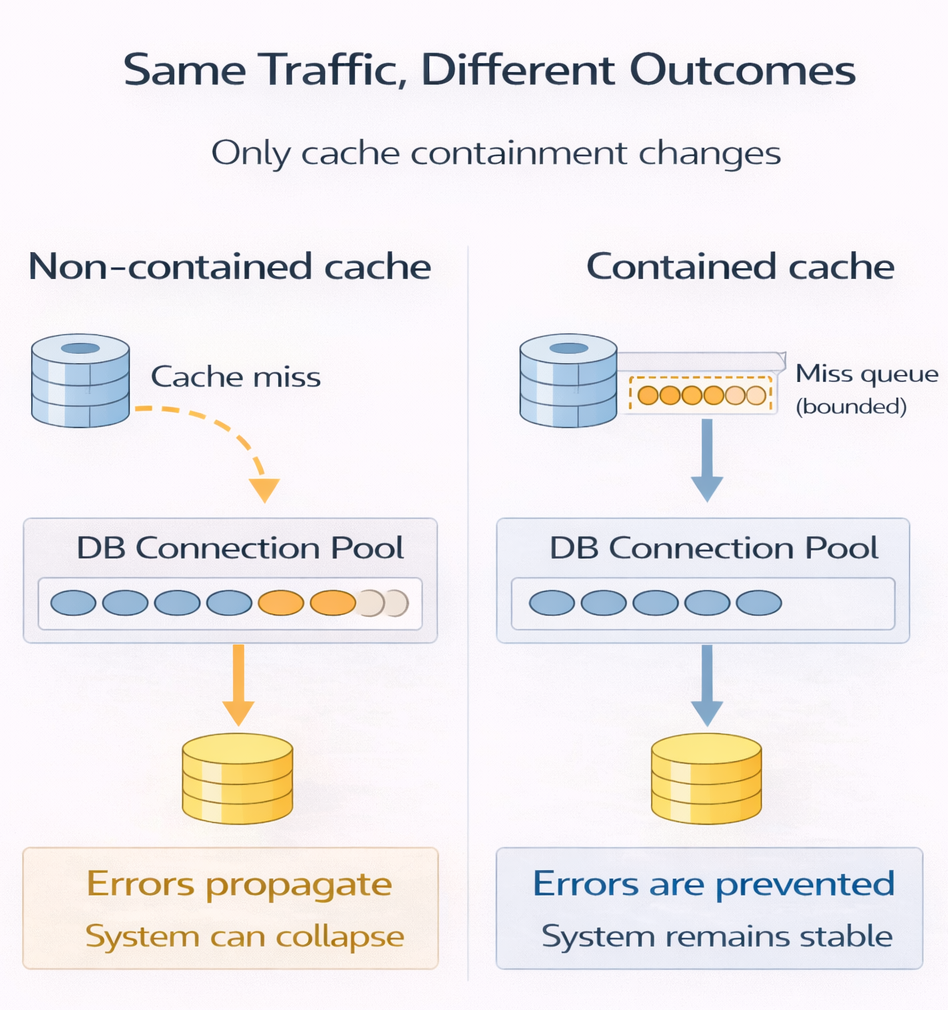
Bounding Misses Instead of Chasing Them
The key idea is simple: cache misses are not allowed to fan out without limit.
This is not the only solution, nor necessarily the best one. It is simply one way to consciously engineer how the system behaves during transitions away from steady state. Other approaches may be more appropriate depending on the system and the goals.
When a request encounters a cache miss, it is no longer free to immediately trigger backend work. Instead, the cache imposes a bound on how many miss-driven backend requests may be in flight at once.
Additional requests encountering the same absence do not create new backend work. They either:
- wait inside the cache boundary, or
- fail fast before entering the backend path
The backend still does the same amount of work.
The database is not made faster.
The incoming request rate does not change.
What changes is where pressure accumulates.
This approach — preventing cache misses from creating an unbounded spike of database load — is what we refer to here as Cache Containment.
Cache containment does not reduce work.
It decides where that work is allowed to wait.
Consequences of Requests Waiting at the Cache Layer
What the user experiences:
- Some requests wait briefly or fail fast under load
- Latency becomes bounded and predictable
- Failures surface early instead of cascading
What happens at the cache:
- Requests are queued passively, not actively processed
- No expensive computation or I/O is performed while waiting
- CPU stays low; memory usage is explicitly bounded
- The cache does not amplify work — it only gates it
The cache is not “doing work” — it is only deciding who is allowed to do work next.
Why This Is Better Than Unbounded Work Passed Downstream to the Database
- Databases actively execute work (queries, locks, I/O); waiting there is expensive
- Unbounded misses translate into unbounded database connections and queries
- Queues grow invisibly and tail latency explodes
- Timeouts trigger retries, multiplying load and accelerating collapse
With cache containment:
- Backend load is capped
- Failure is explicit and controlled, not delayed and catastrophic
- Recovery is fast once load subsides
Letting requests wait at the cache is cheap.
Letting them wait in the database is dangerous.
How the System Responds Differently
With containment in place, the same disturbance produces a different shape of behavior.
Cache misses still occur.
The backend is still limited by the same connection pool.
Requests still arrive at the same rate.
But the fan-out is capped.
Instead of hundreds of requests racing toward the database, only a bounded number are allowed through. Others wait at the cache boundary, where waiting is explicit, visible, and cheap.
In our simulation, a maximum of 5 cache misses are allowed to trigger database loads simultaneously; the rest wait at the cache boundary. The number itself is not important — it simply makes the containment effect visible. The deeper idea is what matters.
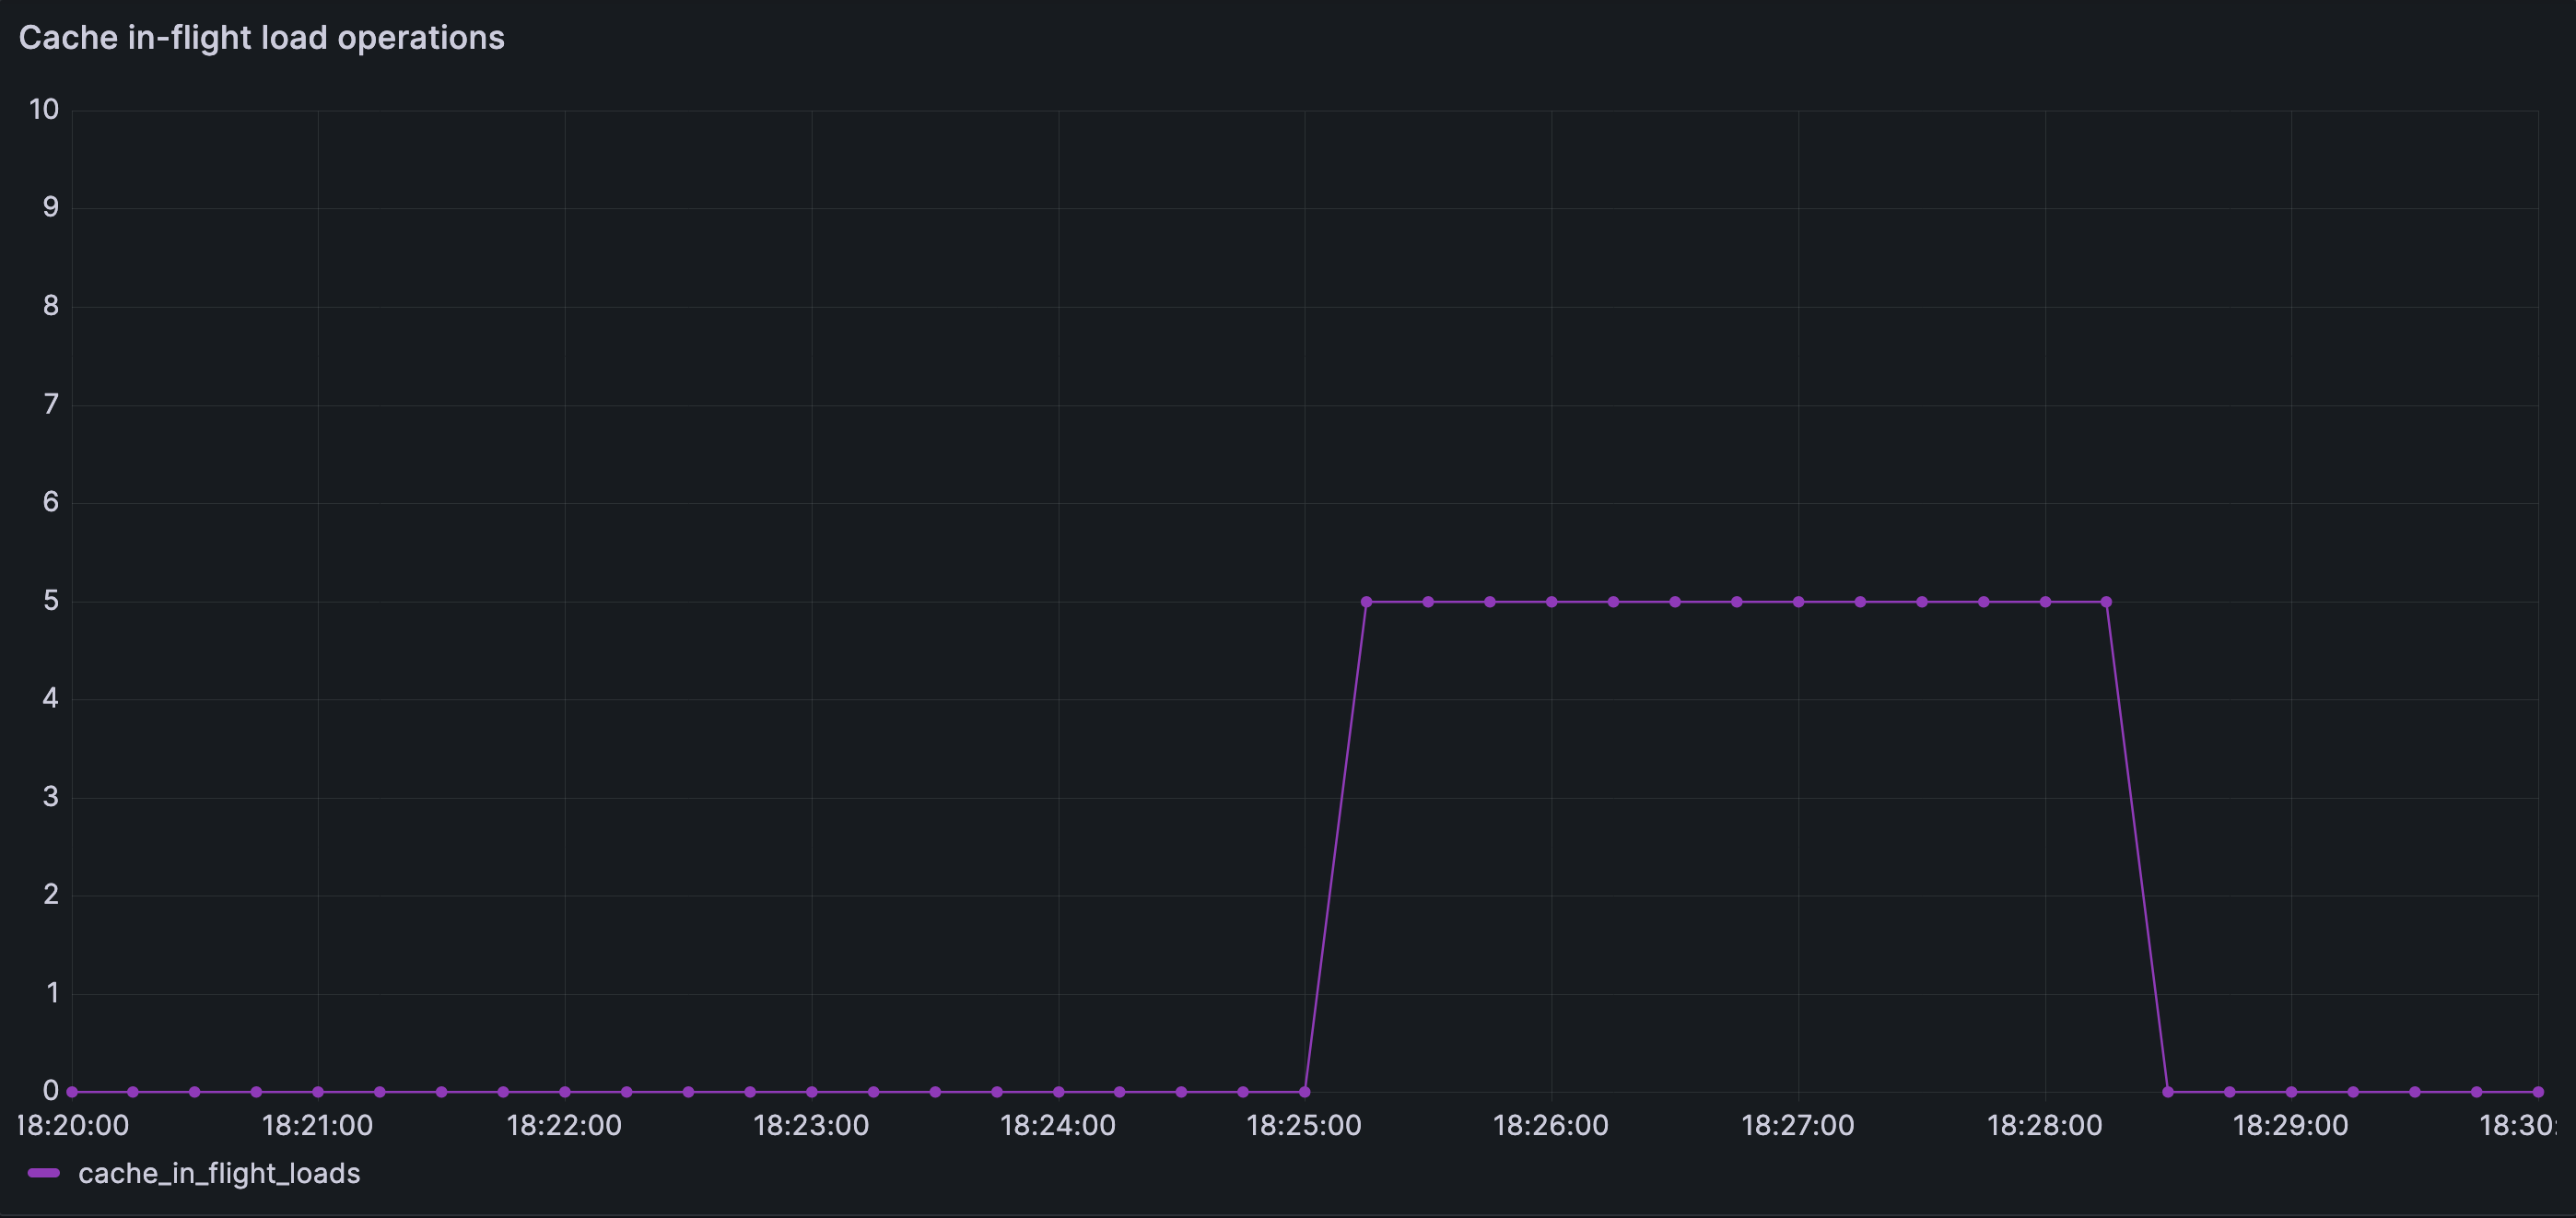
Cache load concurrency is explicitly bounded. Even during the disturbance, the number of concurrent cache fills never exceeds the configured limit, preventing cache miss fan-out from amplifying downstream load.
The following Grafana images compare contained and non-contained cache behavior under the same disturbance.
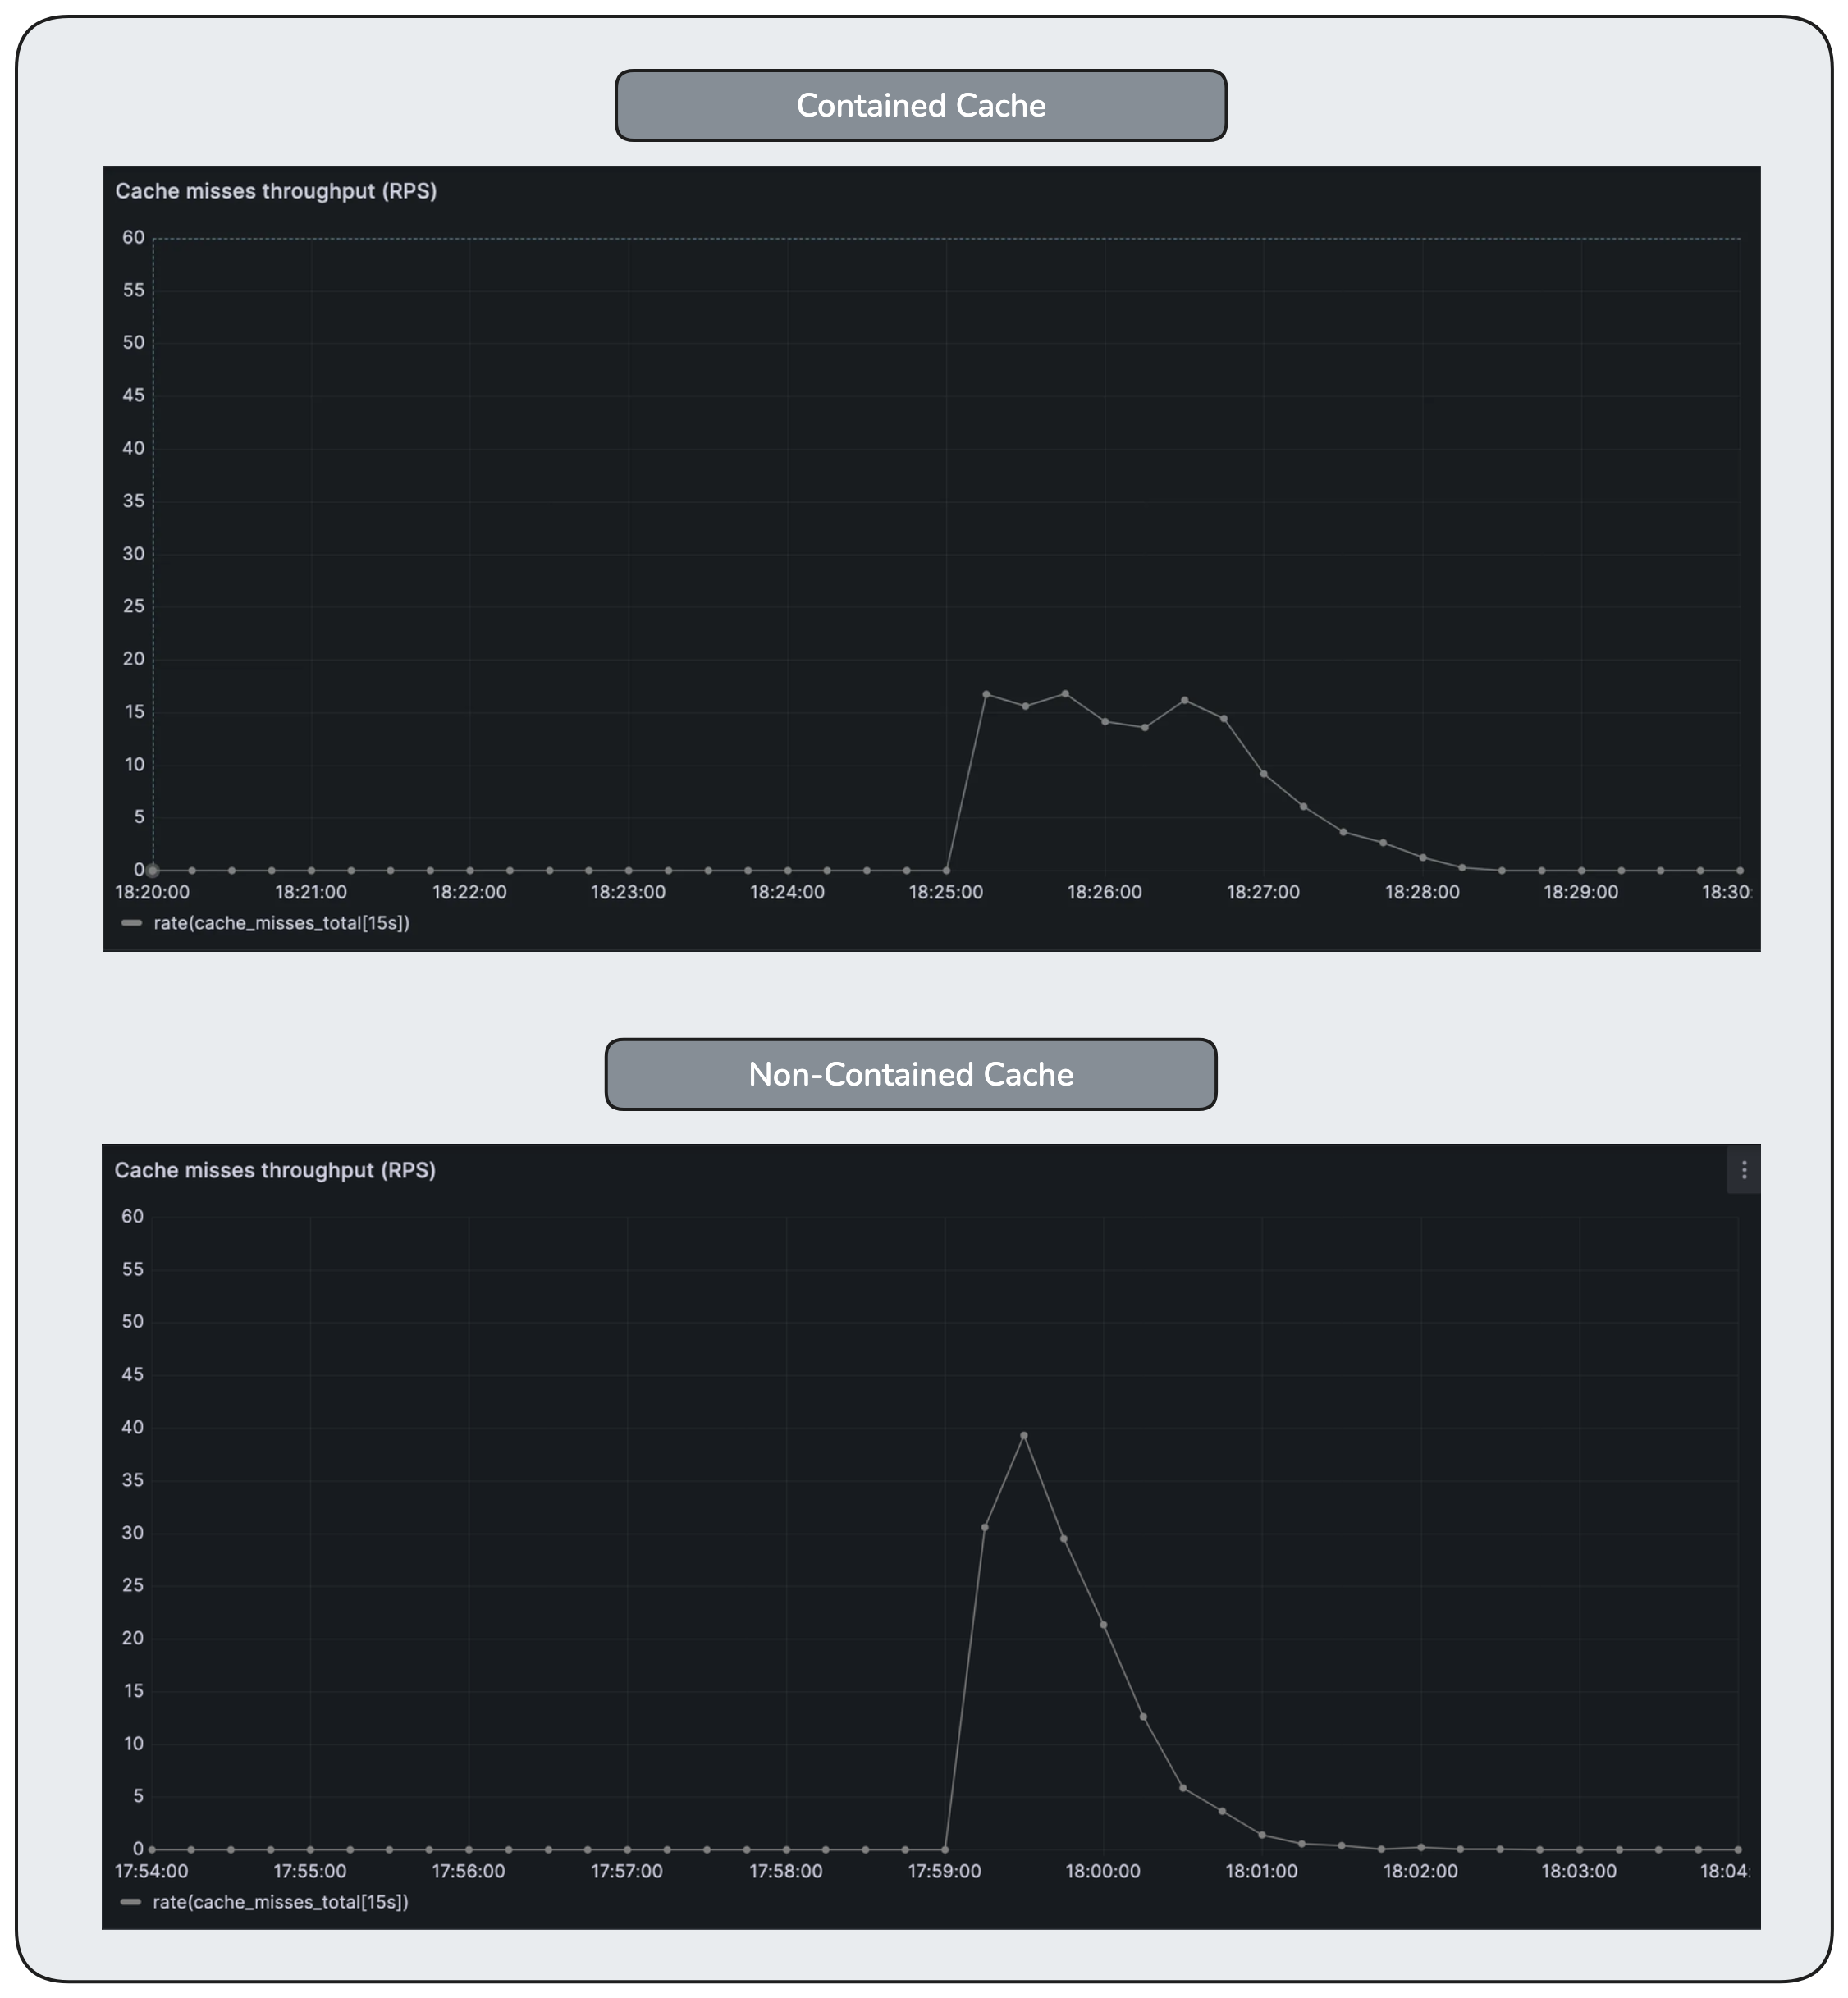
Cache misses increase briefly after the disturbance, but are released at a controlled rate rather than all at once. The system absorbs the shock by spreading recovery over time instead of amplifying downstream load.
As a result:
- database waiting remains short-lived
- timeouts are rare
- failures are limited and predictable
- recovery is smooth once cache locality returns
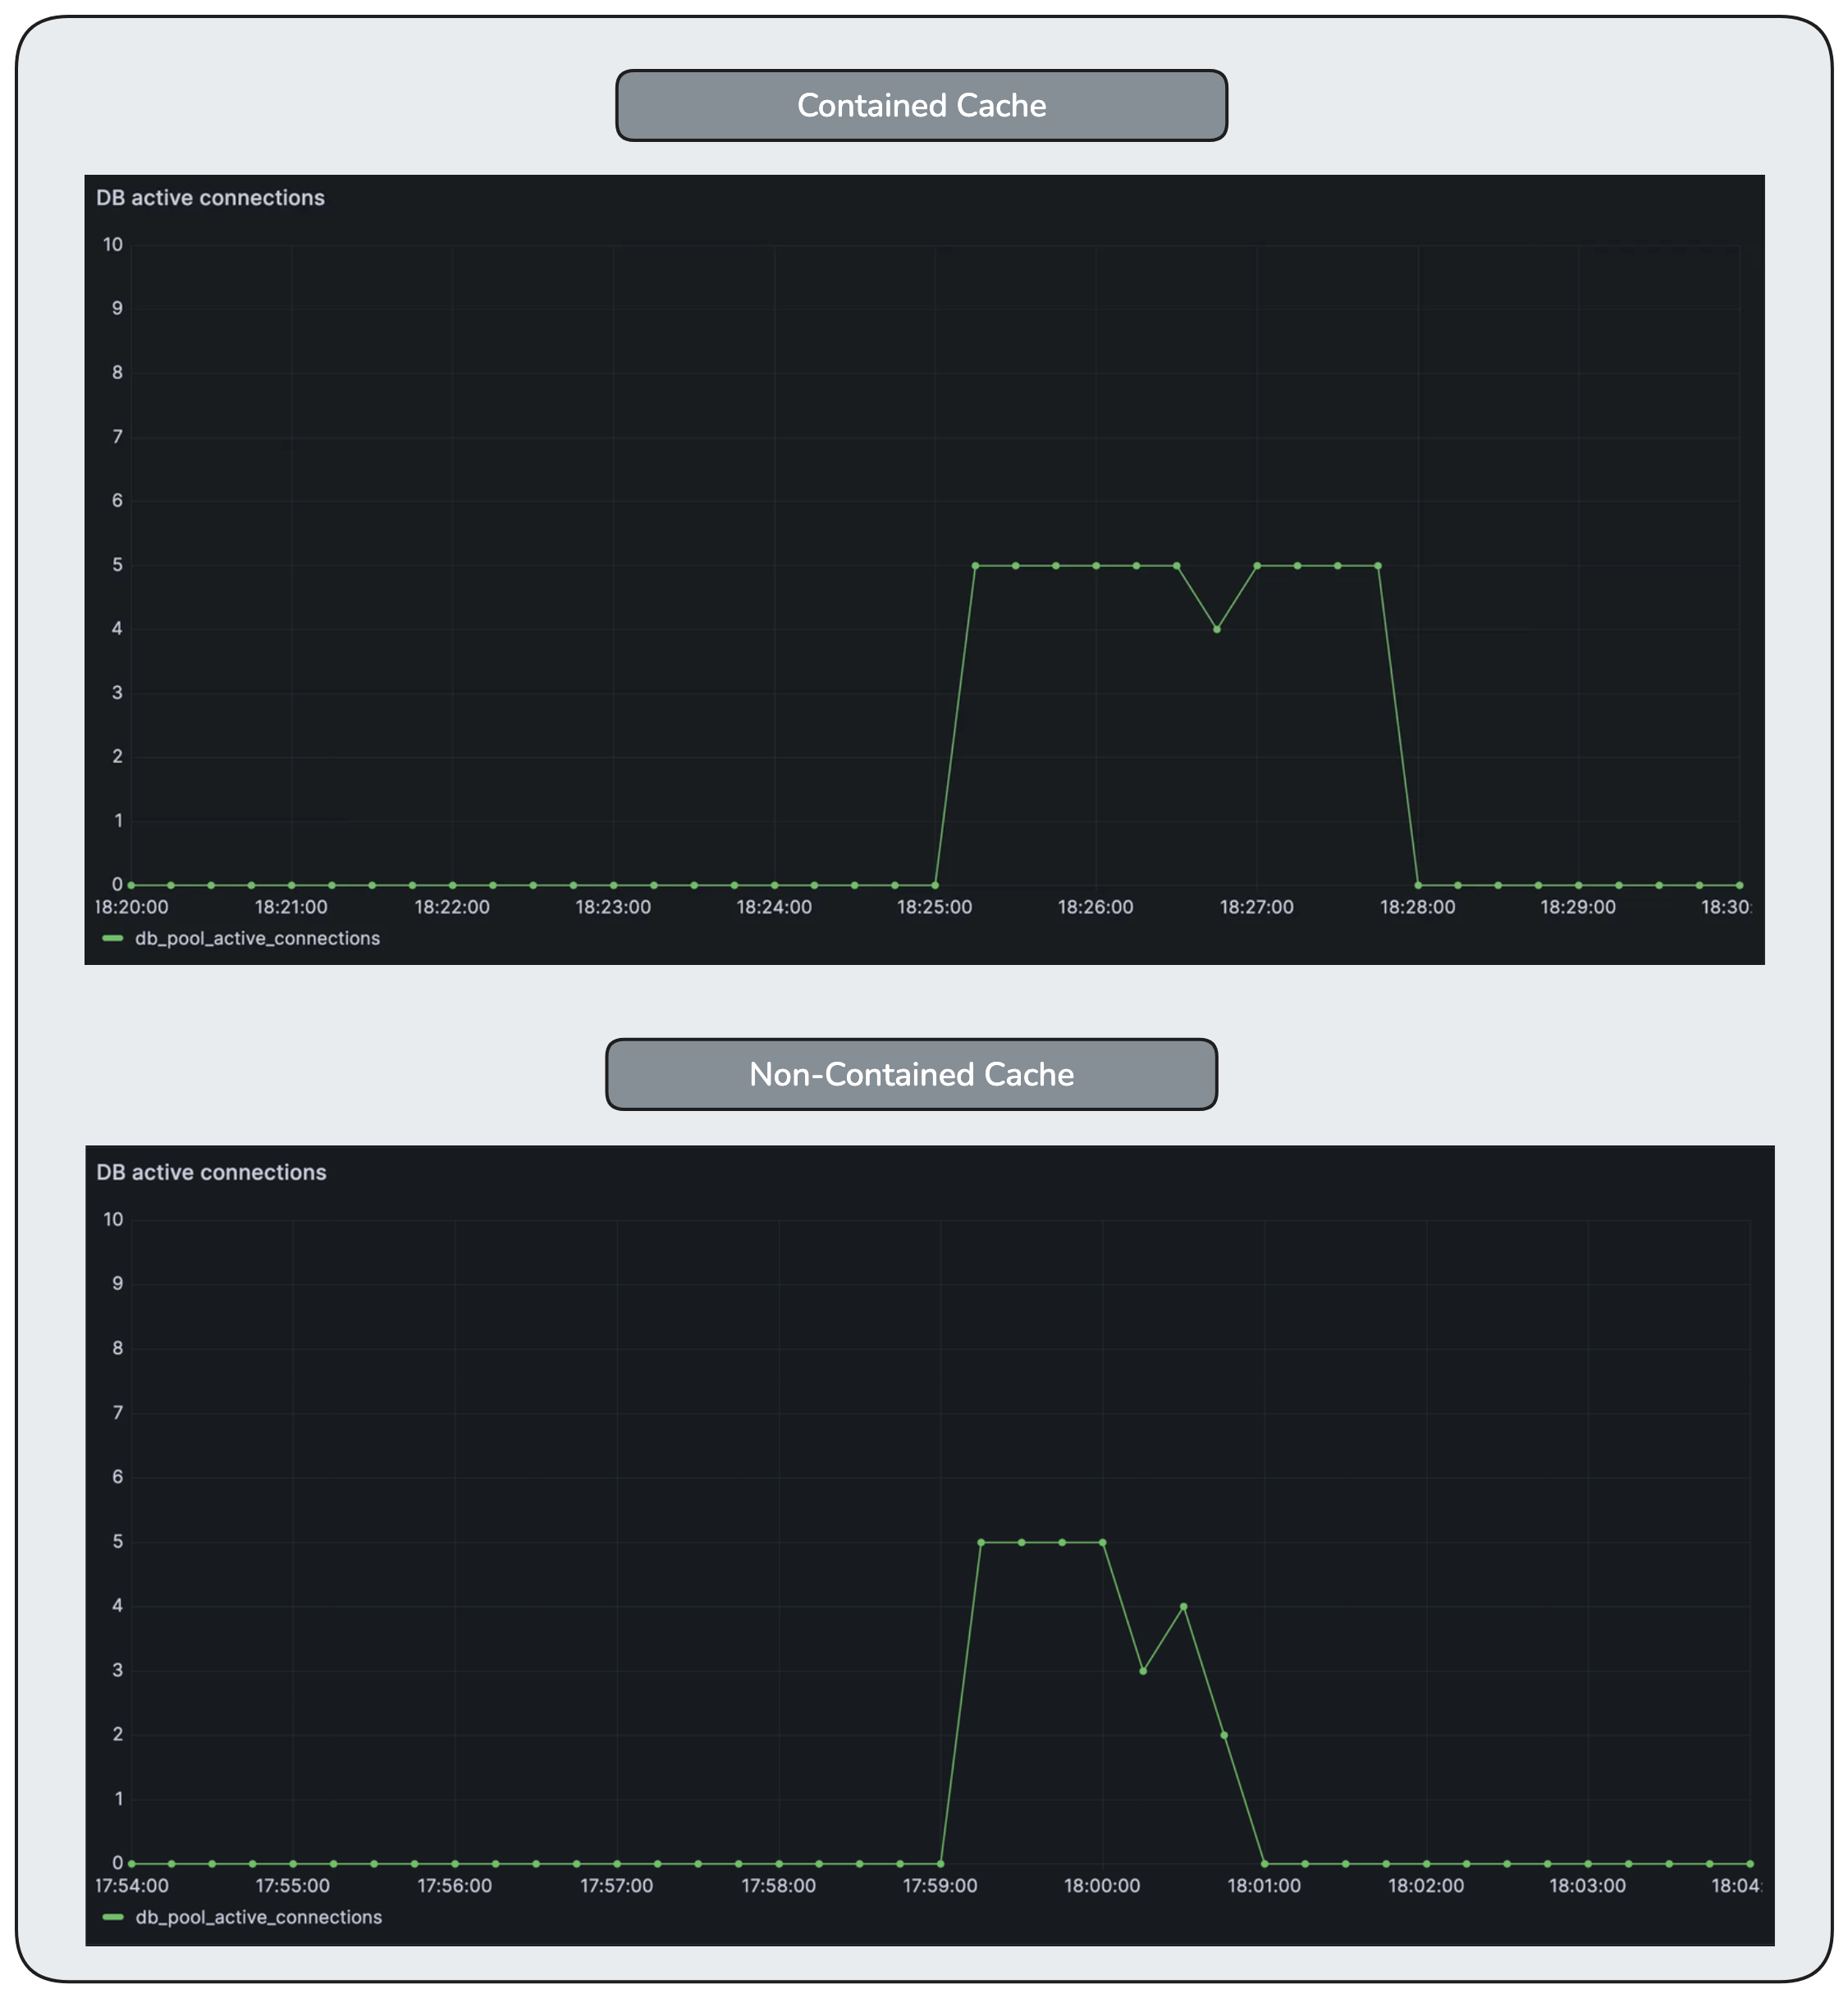
Database concurrency rises and reaches its configured limit, but remains stable. Unlike the non-contained case, the database is never forced to absorb an unbounded surge of work.
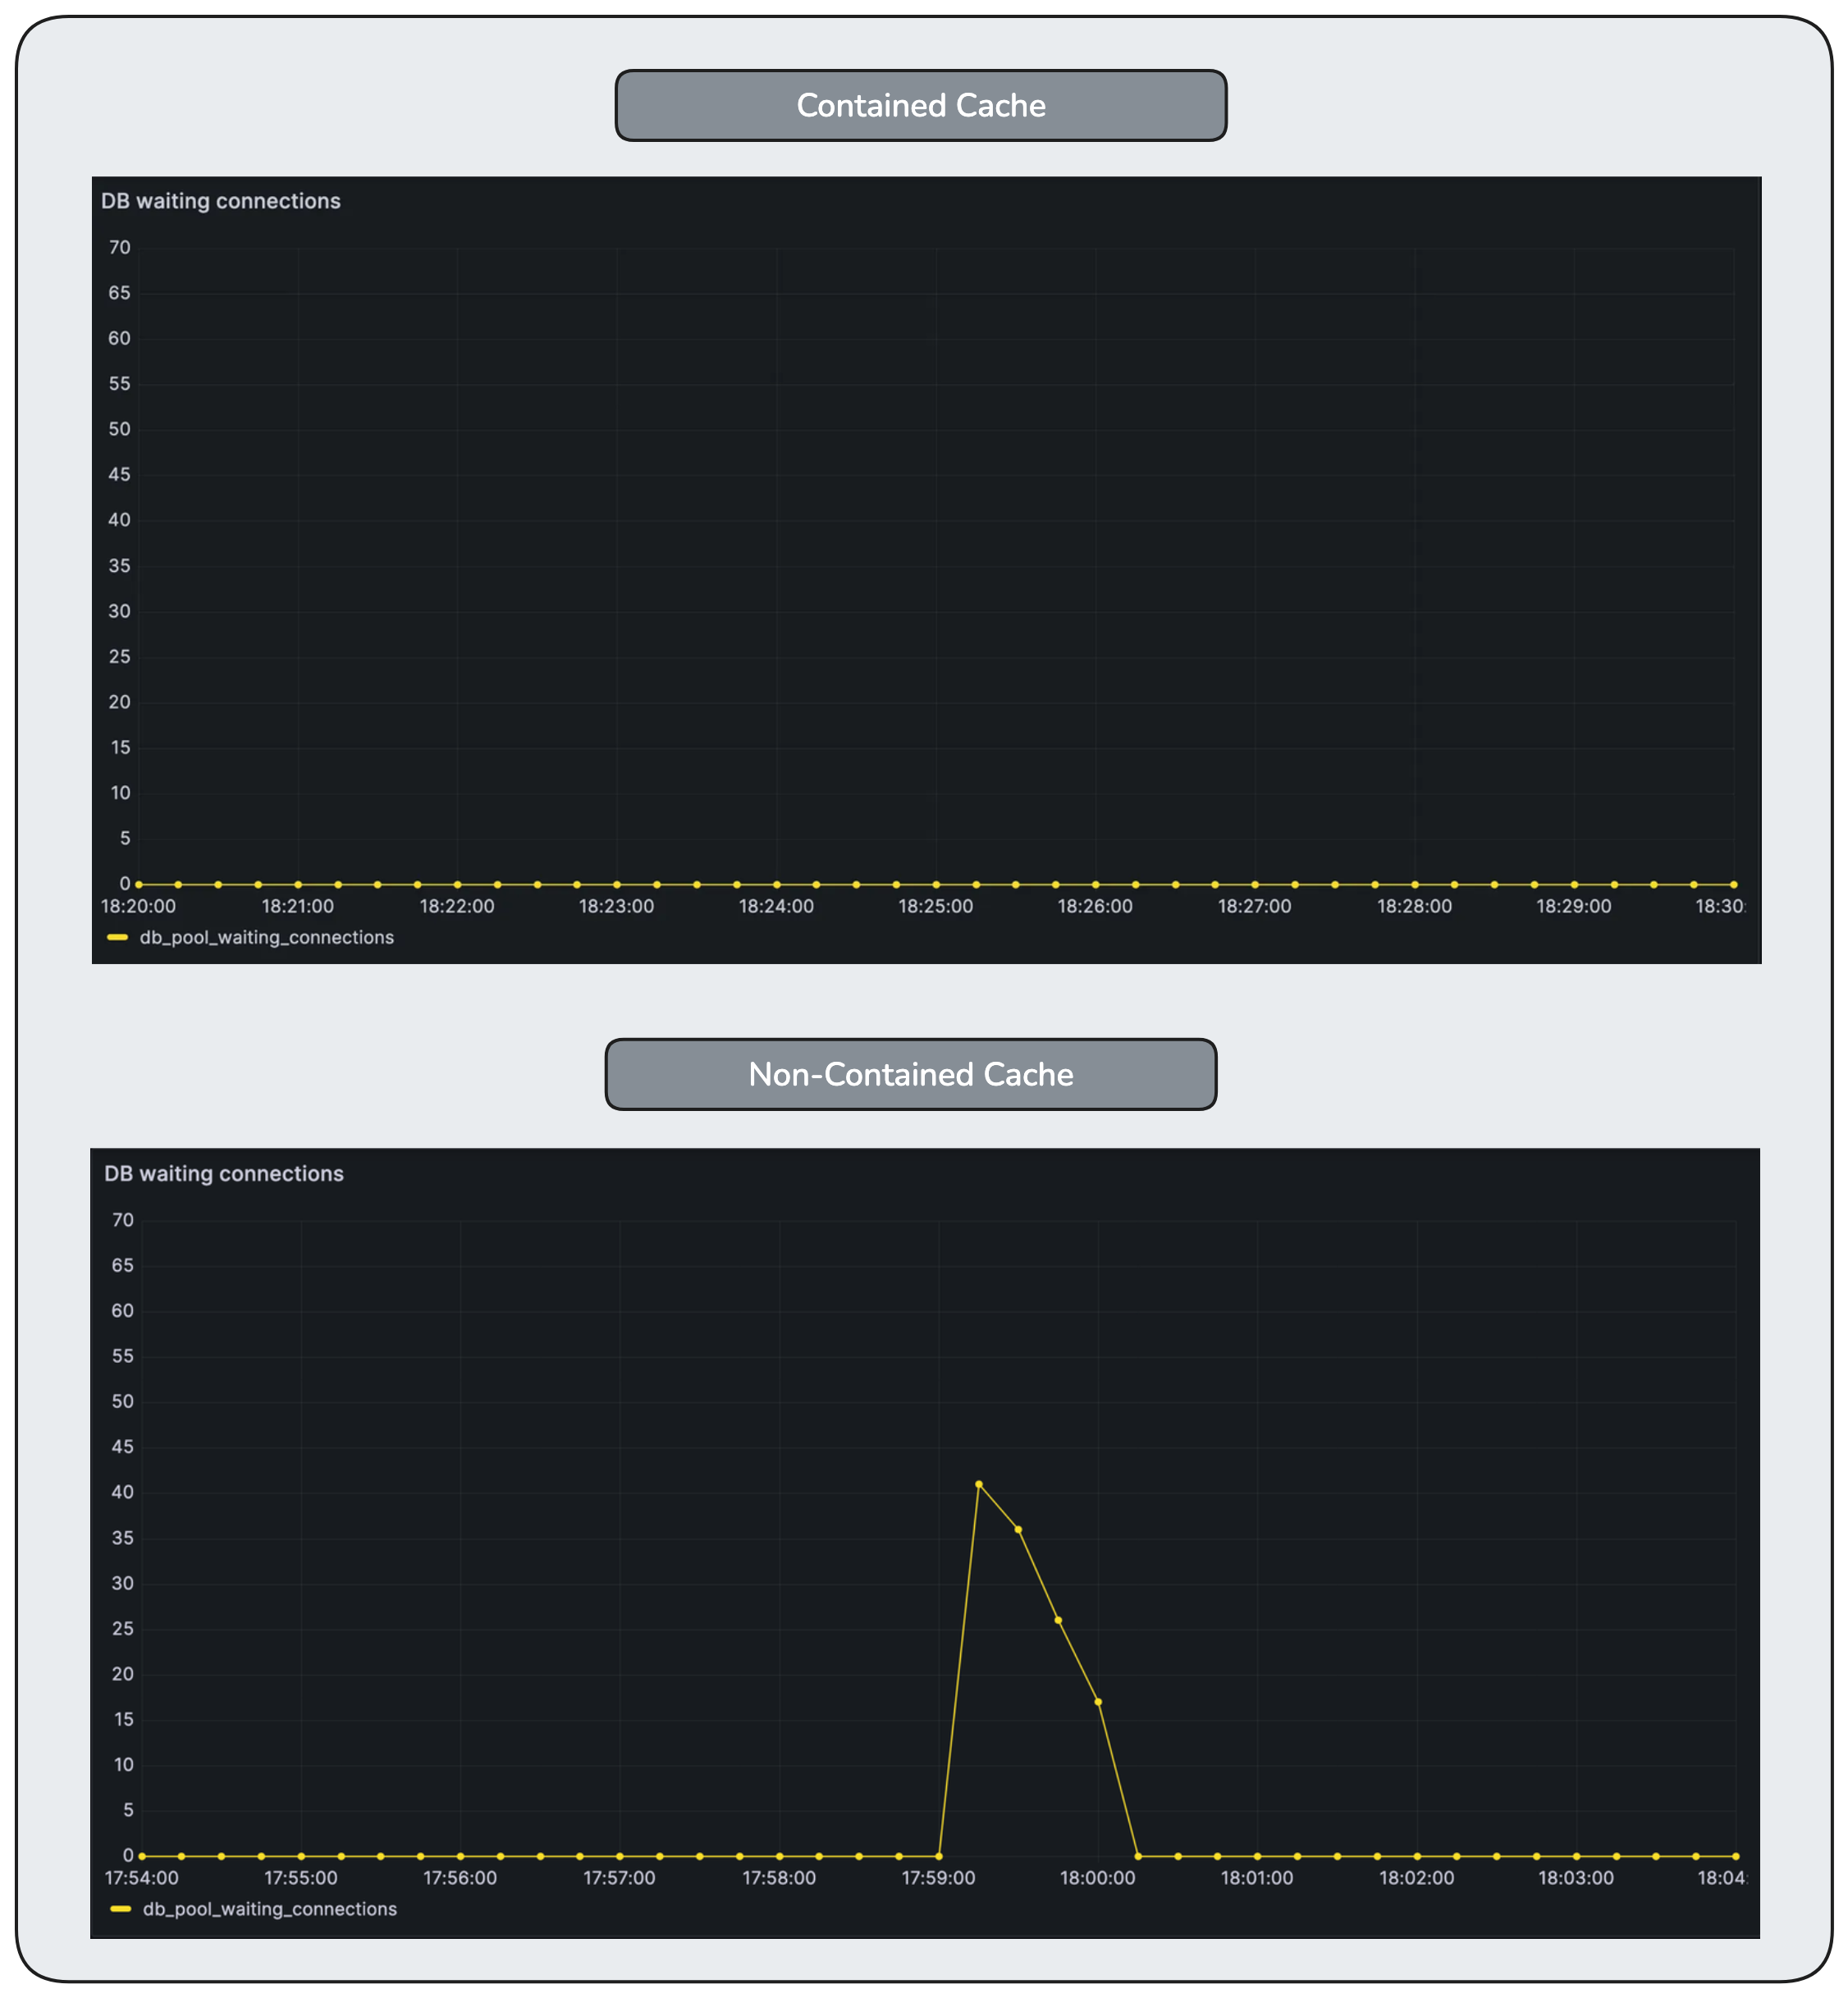
Waiting is nearly eliminated at the database layer. Backpressure is applied earlier in the request path, preventing queue buildup in a resource that cannot safely scale.
Latency does increase temporarily. But it increases deliberately, not accidentally.
Containment trades peak latency for system survivability.
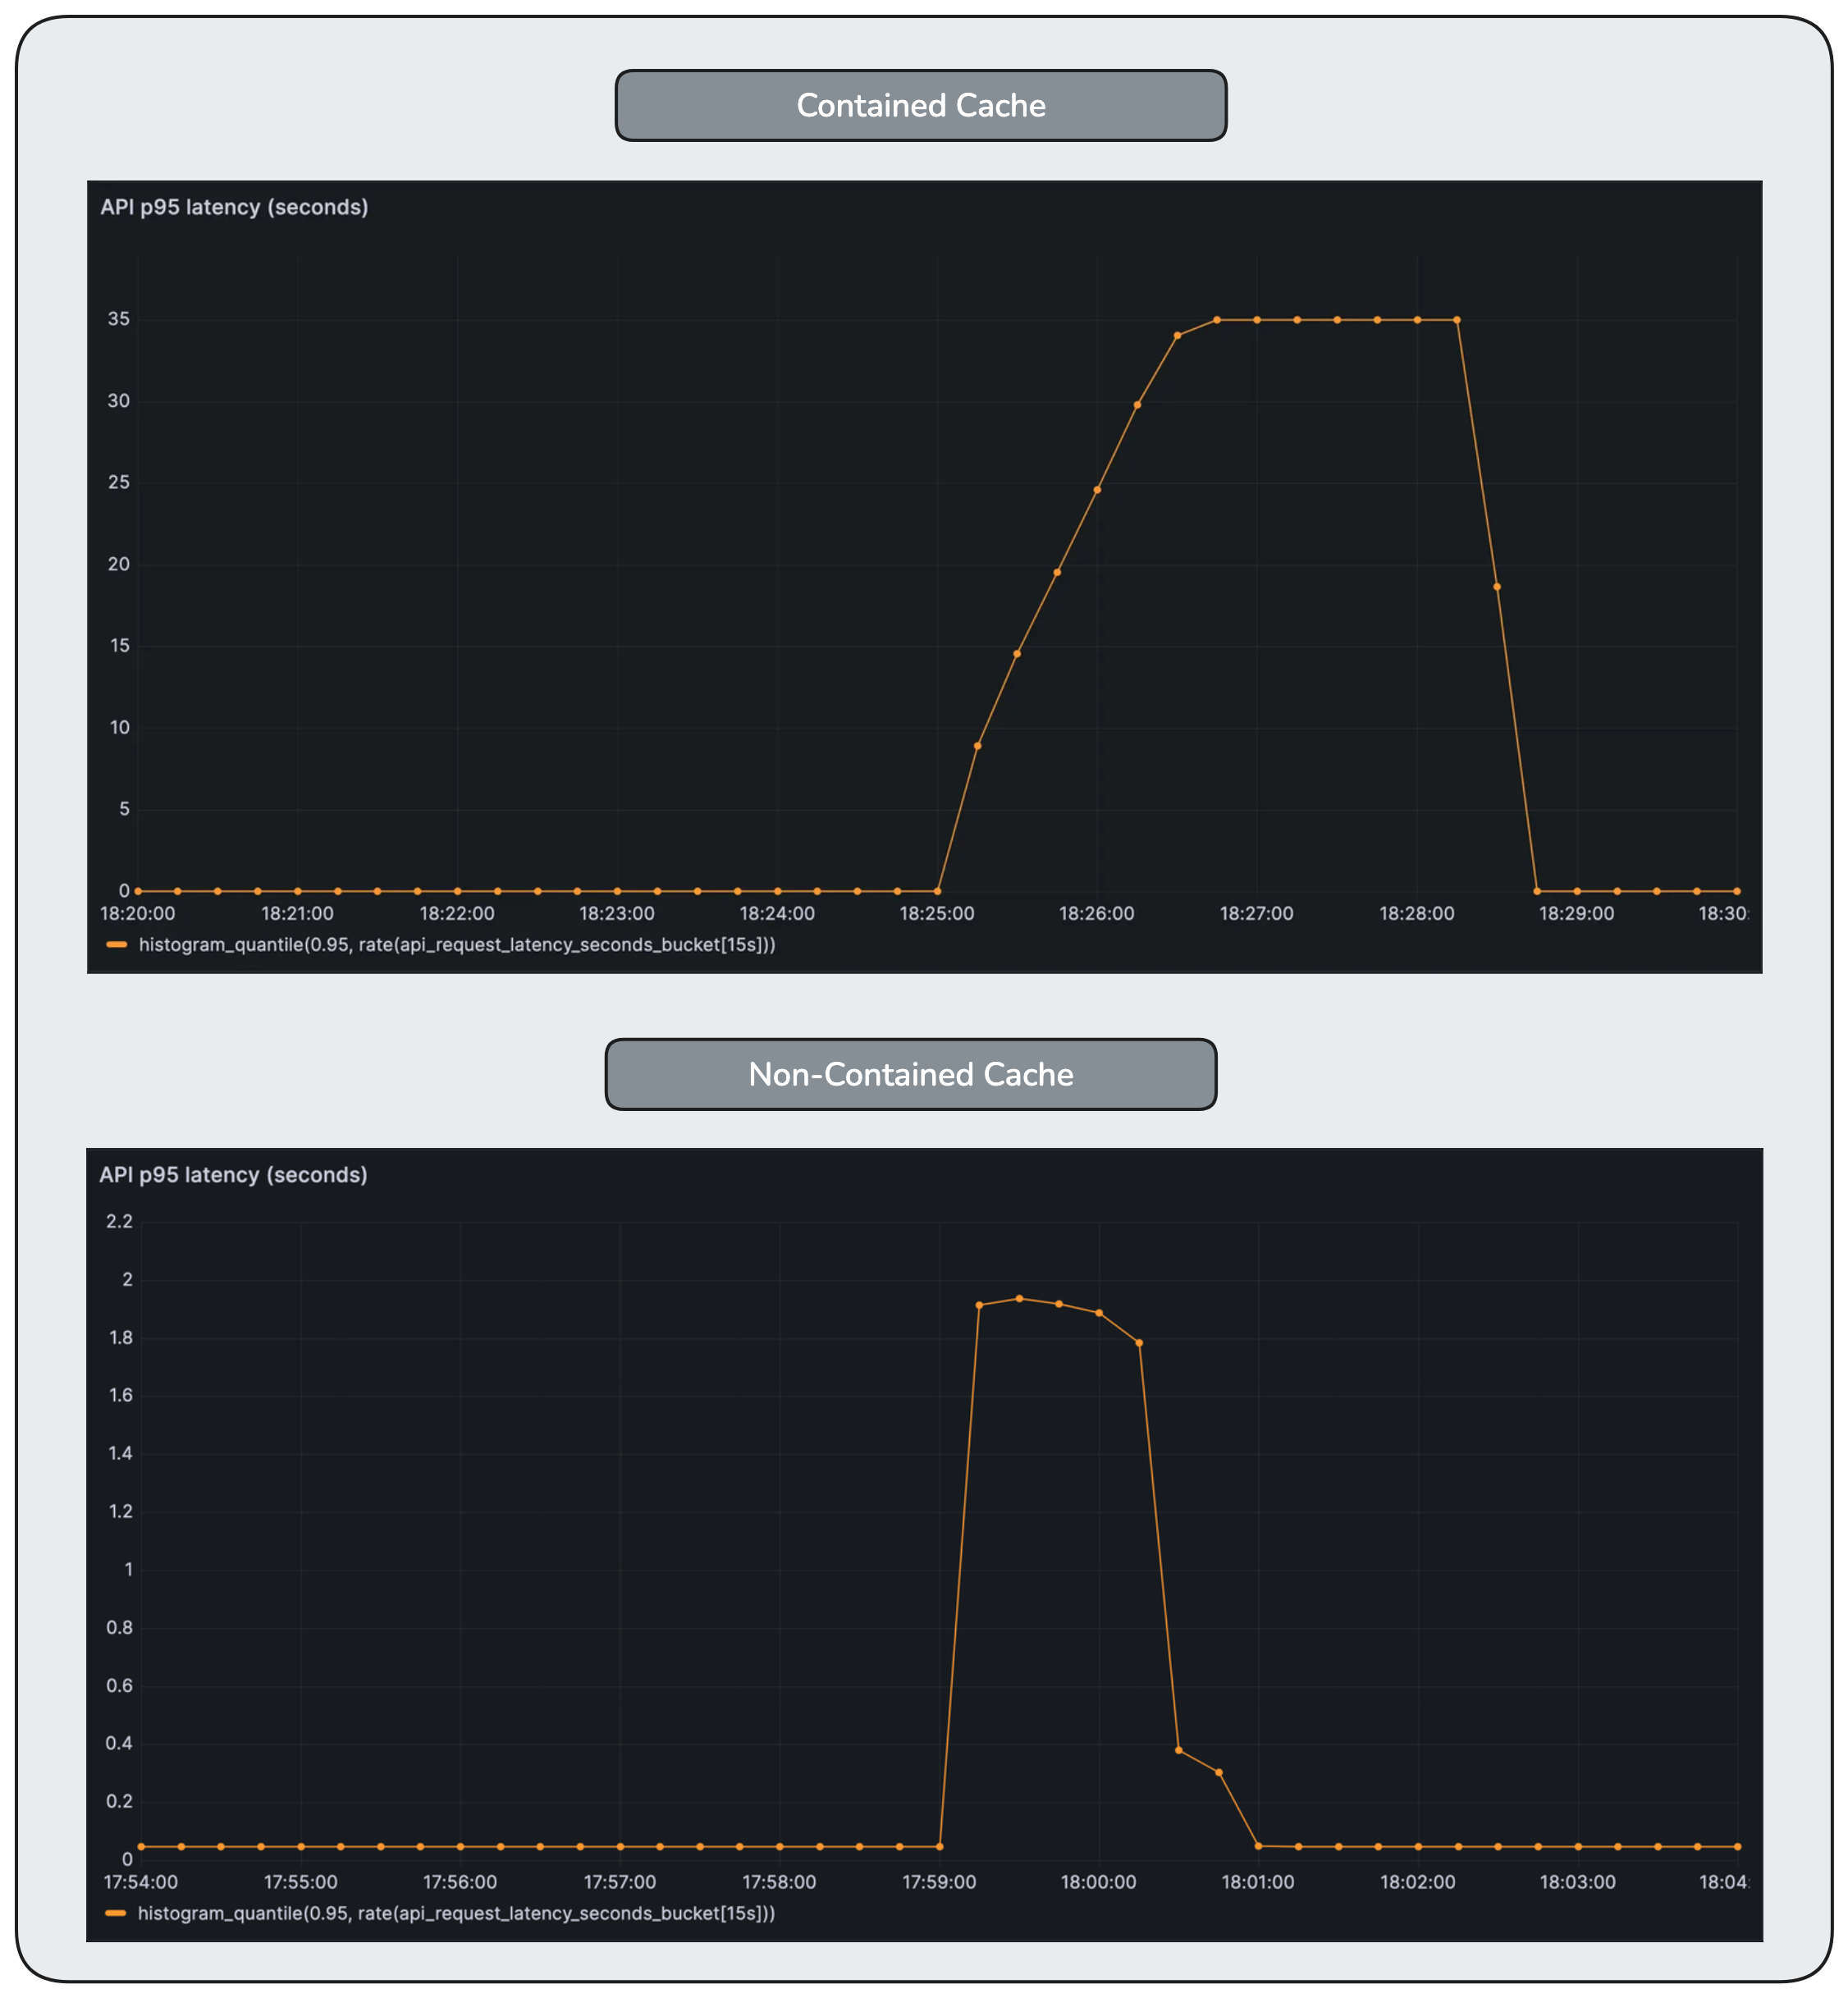
Tail latency increases during the disturbance, but the failure rate remains low. Requests wait longer, but they complete predictably instead of timing out en masse.
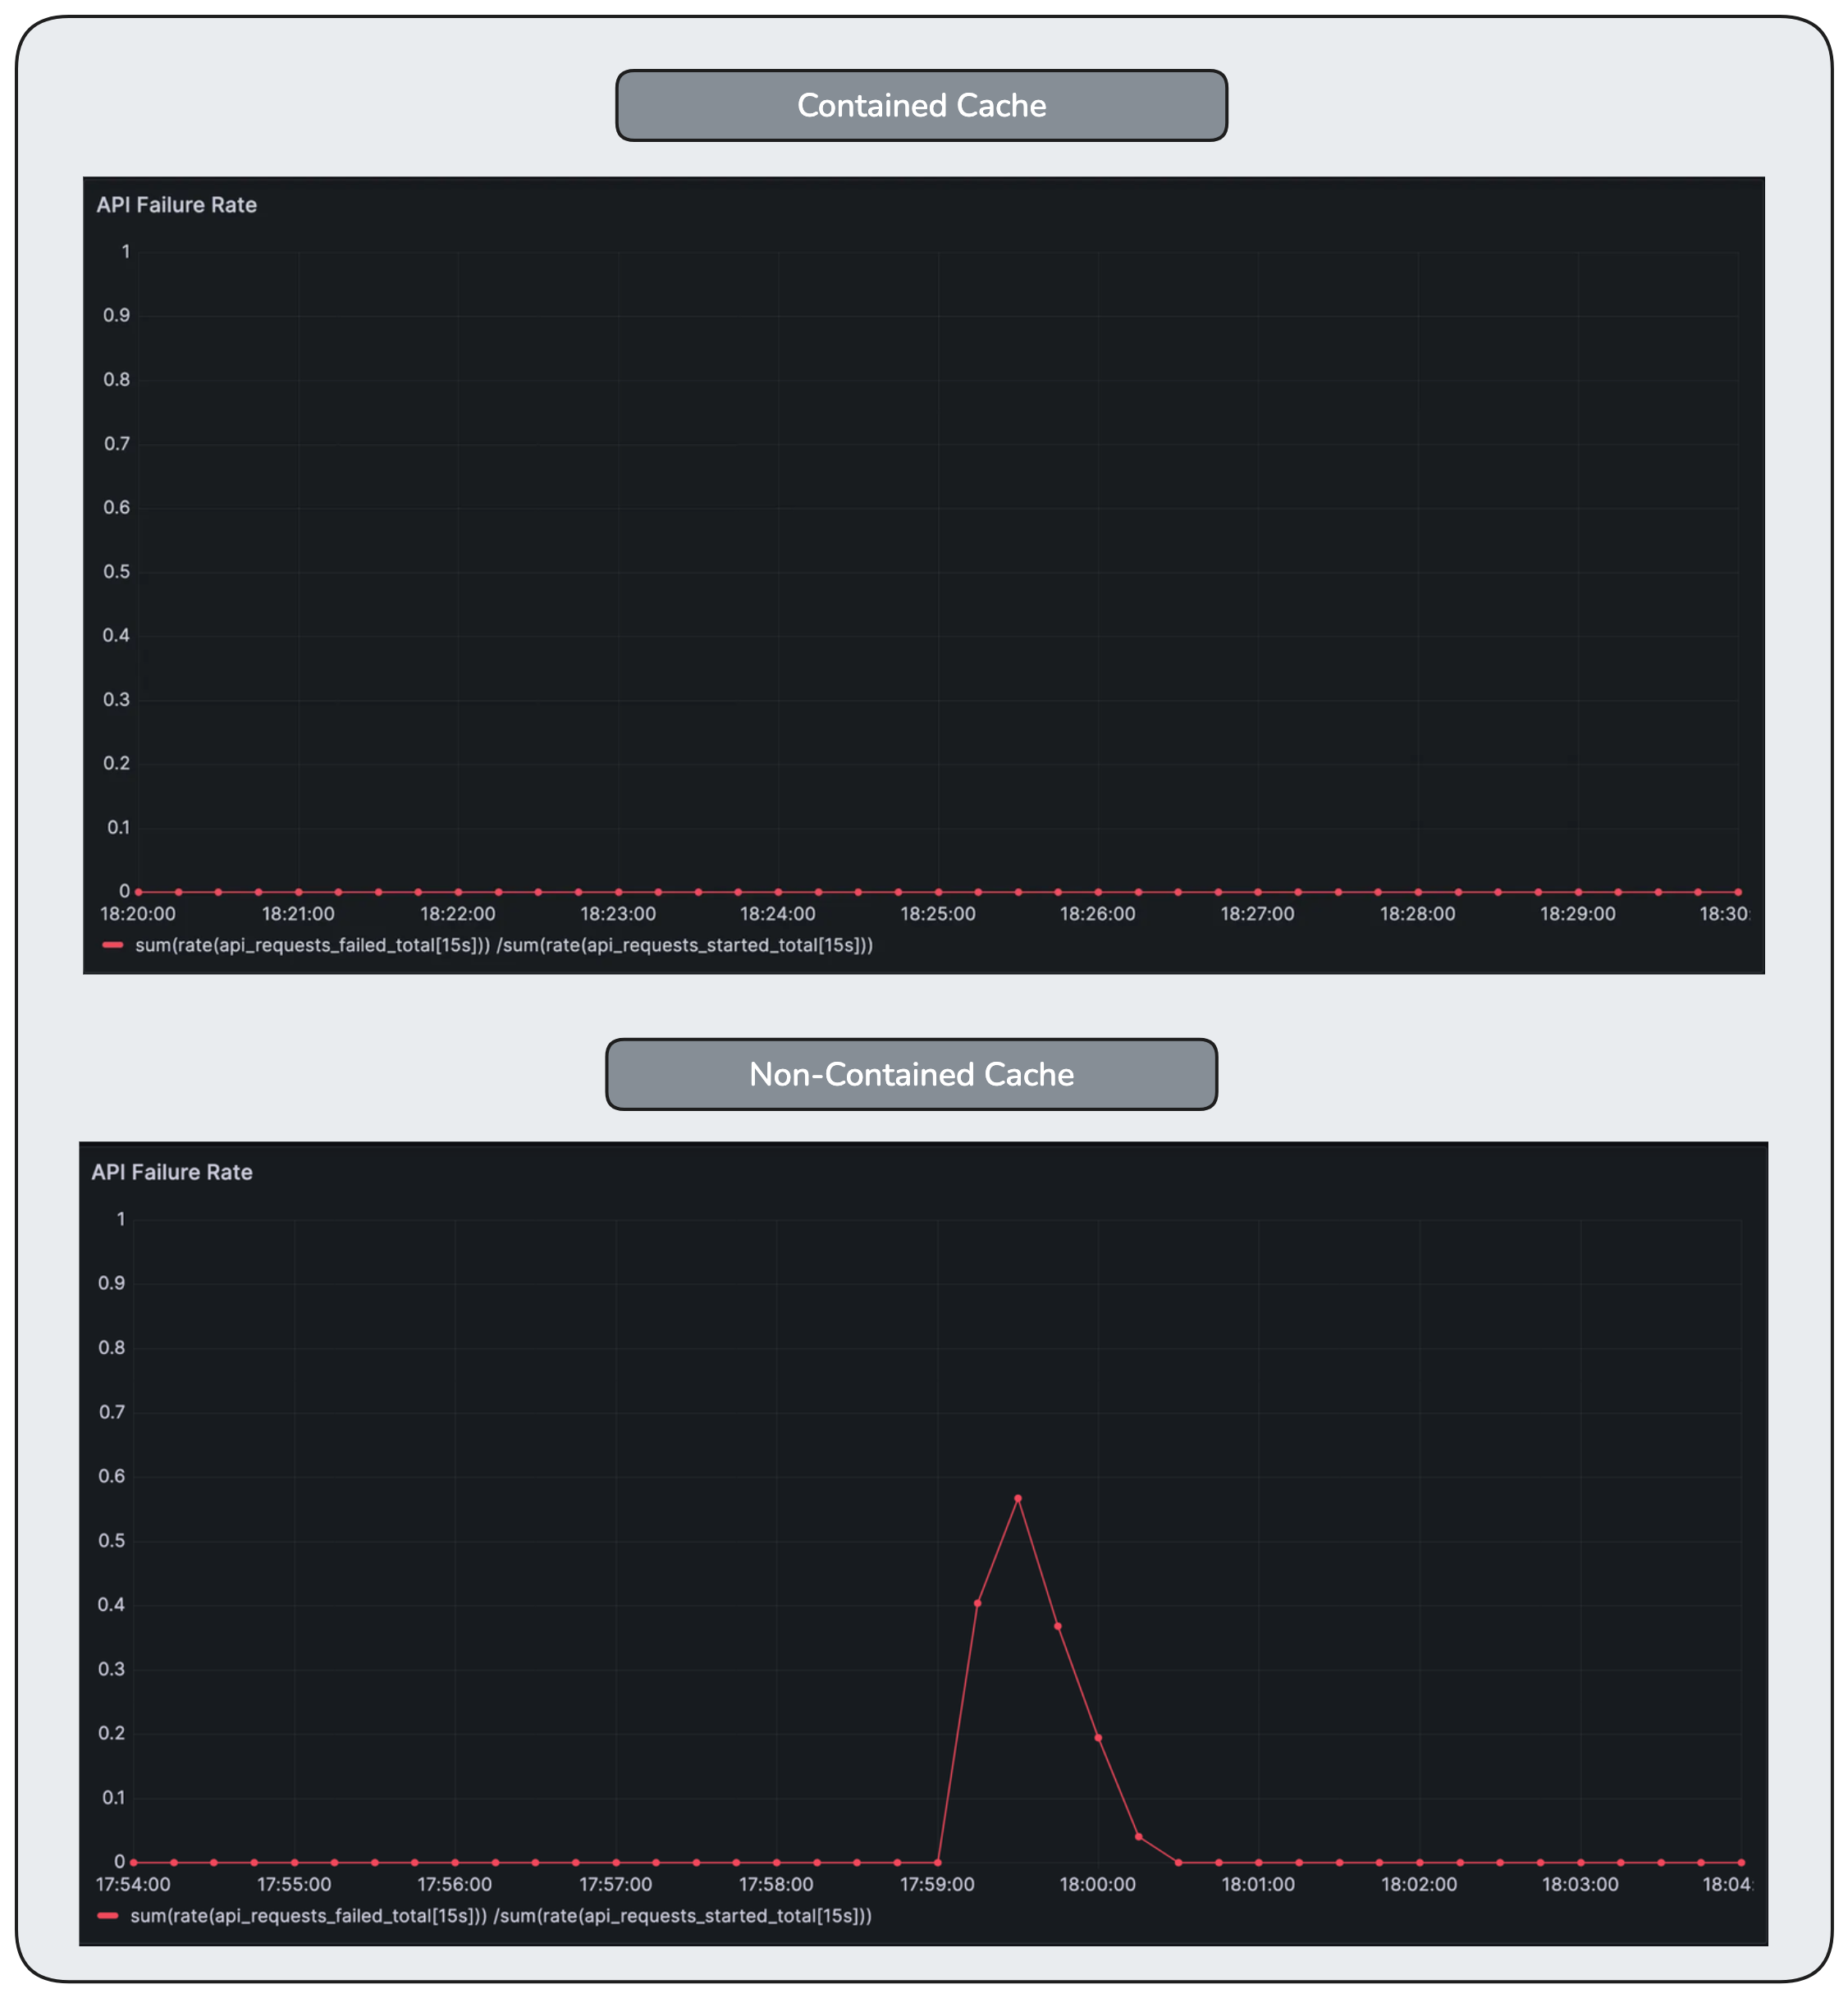
Error rate remains low even during the disturbance. By bounding concurrency at the cache, the system avoids the timeout-driven failure spiral seen in the non-contained case.
Why This Feels Different Operationally
Perhaps the most important change is not visible in a single metric.
With containment, the system fails predictably.
When pressure rises:
- some requests are slowed
- some may be rejected early
- the backend remains stable
- queues do not migrate invisibly
The system becomes easier to reason about under stress. It no longer oscillates between “looks fine” and “falls over”. In the previous case, pressure accumulated at the database, migrated upstream, and eventually resulted in systemic failure. Consciously engineering failure modes prevents such collapse.
This does not mean the system is now faster or more efficient, but its failure modes are more deliberately shaped and the system becomes more resilient.
A system that fails predictably is healthier
than one that appears fast until it collapses.
What Containment Is — and Isn’t
Cache containment is not a performance optimization.
It does not improve steady-state latency.
It does not eliminate cache misses.
It is an admission control mechanism.
It answers the question the system previously deferred:
How much miss-driven work should be allowed into the backend at once?
Once that question is answered explicitly, many of the confusing behaviors seen earlier no longer emerge.
8. How to Look at Systems Like This
The system in this article is intentionally simple. Most production systems are not.
They have more layers, more services, more caches, more queues, more retries. But the behaviors we observed here are not artifacts of simplicity. They are consequences of structure.
What matters is not the specific components, traffic numbers, or pool limits used in the simulation, but the questions the system answers—explicitly or implicitly.
Where Is Work Allowed to Queue?
Every system queues work somewhere.
Sometimes it is obvious: a connection pool, a message queue, a worker pool.
Sometimes it is not: request handlers, thread schedulers, memory buffers.
The critical question is not whether work queues, but where it is allowed to do so.
When queues form close to explicit limits, pressure is visible and bounded.
When they migrate upstream, pressure becomes diffuse and hard to reason about.
The most dangerous queues are the ones you didn’t design.
Which Limits Are Policies, and Which Are Accidents?
Some limits are chosen deliberately:
- connection pools
- bounded queues
- admission controls
Others are side effects:
- CPU saturation
- memory pressure
- scheduler contention
Both constrain throughput. Only the first group shapes behavior intentionally.
When a system relies primarily on implicit limits, failure tends to appear late and ambiguously. When it relies on explicit ones, failure appears earlier—but is clearer and more contained.
Explicit limits describe what a system chooses not to do.
Implicit limits describe what it cannot do anymore.
What Assumptions Must Remain True?
Many designs work because certain conditions quietly hold:
- cache misses are independent
- traffic is well-distributed
- retries are rare
These assumptions are rarely written down. They are inferred from steady-state behavior.
The moment they stop holding, the system does not gradually degrade—it often changes character entirely.
Steady state teaches you how a system behaves
when its assumptions are intact.
Why Observability Alone Isn’t Enough
The system in this article was observable. Metrics were present. Dashboards were populated.
What was missing was not data, but a lens.
Observability showed reactive signals—metrics that surfaced after the system had already crossed into a non-steady-state failure mode. By the time queues migrated and waiting propagated upstream, the graphs reflected the outcome, not the cause.
They describe what is happening, but not necessarily why the system behaves that way.
Observability metrics are often effective in steady state, but far less useful during transitions, when the system leaves its normal operating regime.
Observability shows the shape of the system.
Design explains why that shape exists.
Observability is essential.
Design is what lets us read the signals before they harden into failure.
What This Article Was Really About
This article was not about caches, databases, or connection pools.
It was about how control, coordination, and admission interact under ordinary conditions—and how small, reasonable design choices combine into failure modes that feel surprising only because we rarely articulate the assumptions behind them.
This wasn’t only an article about cache containment.
It was about sharpening how we see systems.
About learning to notice second-order effects instead of just first-order symptoms. About making implicit assumptions visible—steady state, uniform load, benign misses—and recognizing when they stop holding. About seeing caches not just as memory optimizations, but as traffic regulators. About understanding the difference between explicit limits that shape behavior and implicit limits that reveal themselves only after damage is done.
It was about timeouts as signals that arrive late, retries as silent work multipliers, and why adding capacity often moves the breaking point without changing the failure shape. About steady states versus transition states—and why many systems look healthy right up until they aren’t. About asking where waiting is allowed to accumulate, and what happens when it is pushed downstream by accident rather than design.
And finally, it was about the limits of observability itself—how graphs can look calm while pressure redistributes beneath them, and why understanding structure matters as much as measuring outcomes.
Cache containment is one concrete technique. But the deeper goal is a better lens: one that helps you reason about systems before they fail, not just explain them after.
And in distributed systems, a boring, predictable failure is often one of the most valuable outcomes you can design for.
If you'd like to receive new essays when they’re published, you can subscribe below.
No fixed schedule. No noise.